
Page 70 - May 2017
P. 70
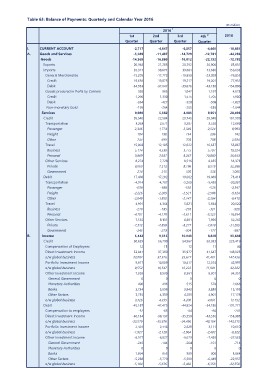
Table 63: Balance of Payments: Quarterly and Calendar Year 2016
2016 1 (Rs million)
1st 2nd 3rd 4th 2 2016
Quarter Quarter
Quarter Quarter -18,881
-2,717 -4,660 -44,286
I. CURRENT ACCOUNT -5,289 -4,647 -6,857 -12,781 -72,782
A. Goods and Services -14,369 -11,487 -14,729 -22,732
20,948 -16,869 -18,812 83,851
Goods -35,317 20,906 -156,633
Exports -15,295 21,205 20,792 -43,638
Imports 19,658 -38,074 -39,604 -23,929 -76,855
General Merchandise -34,953 -17,772 -19,859 19,201 77,951
Credit 19,875 19,217 -43,130 -154,806
Debit 926 -37,647 -39,076
Goods procured in Ports by Carriers 1,290 1,197 4,073
Credit -364 903 1,047 1,705 5,900
Debit -195 1,330 1,575 -508 -1,827
Non-monetary Gold 9,080 -427 -528 -330 -1,044
26,540 -264 -255 9,951 28,496
Services 3,263 5,382 4,083 29,040 101,909
Credit 2,346 22,584 23,745 3,528 12,669
Transportation 2,671 3,207 2,524 8,993
Passenger 184 1,774 2,349
Freight 733 206 742
Other 15,003 198 154 798 2,934
Travel 5,114 699 704 16,657 55,867
Business 9,889 12,185 12,022 5,797 19,224
Personal 8,274 4,538 3,775 10,860 36,643
Other Services 8,060 7,647 8,247 8,855 33,373
Private 214 7,728 8,516 8,519 32,288
Government -17,460 7,513 8,196 336 1,085
Debit -4,914 215 320 -19,089 -73,413
Transportation -639 -17,202 -19,662 -5,450 -20,331
Passenger -2,226 -4,707 -5,260 -578 -2,397
Freight -2,049 -588 -592 -2,508 -9,524
Other -4,991 -2,269 -2,521 -2,364 -8,410
Travel -210 -1,850 -2,147 -5,644 -20,820
Business -4,781 -4,364 -5,821 -321 -926
Personal -7,555 -185 -210 -5,323 -19,894
Other Services -7,312 -4,179 -5,611 -7,995 -32,262
Private -243 -8,131 -8,581 -7,818 -31,265
Government 5,442 -7,858 -8,277 -177 -997
50,629 -273 -304 8,848 33,648
B. Income 9,315 10,043 63,033 225,419
Credit 12 56,790 54,967
Compensation of Employees 33,041 11 46
Direct Investment Income 33,002 11 12 41,647 148,025
o/w global business 37,360 35,977 41,481 147,436
Portfolio Investment Income 9,617 37,326 35,627 12,074
o/w global business 9,552 10,889 10,417 11,901 42,997
Other Investment Income 7,959 10,547 10,222 42,222
General Government 9,301 34,351
Monetary Authorities 0 8,530 8,561 0
Banks 490 0 0 0
Other Sectors 3,734 570 2,068
o/w global business 3,735 493 515 3,830 15,105
Debit 3,726 3,698 3,843 4,901 17,178
Compensation to employees -45,187 4,339 4,203 4,891 17,152
Direct Investment Income -52 4,335 4,200 -54,185 -191,771
o/w global business -36,134 -47,475 -44,924 -241
Portfolio Investment Income -32,579 -60 -153,385
o/w global business -2,424 -65 -64 -43,556 -143,215
Other Investment Income -1,927 -38,137 -35,558 -40,164 -10,610
General Government -6,577 -35,976 -34,496 -8,522
Monetary Authorities -245 -3,111 -27,535
Banks -2,446 -2,629 -2,403 -714
Other Sectors 0 -2,128 -2,064 -7,458
o/w global business -1,094 -6,827 -6,673 0
-5,238 -101 -3,864
-5,104 -104 -264 0 -22,957
0 0 -22,558
-908
-953 -909 -6,449
-5,770 -5,500 -6,358
-5,636 -5,460