
Page 69 - May 2017
P. 69
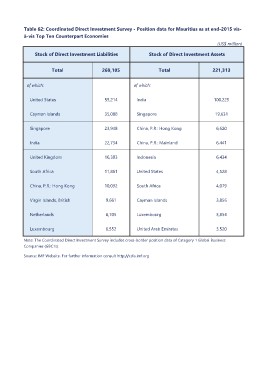
Table 62: Coordinated Direct Investment Survey - Position data for Mauritius as at end-2015 vis-
à-vis Top Ten Counterpart Economies

                                                                                                                                    (US$ million)

Stock of Direct Investment Liabilities         Stock of Direct Investment Assets

           Total         269,105                   Total        221,313

of which:                               of which:

United States            55,214         India                   100,225

Cayman Islands           35,008         Singapore               19,631

Singapore                23,948         China, P.R.: Hong Kong  6,620

India                    22,734         China, P.R.: Mainland   6,441

United Kingdom           16,303         Indonesia               6,434

South Africa             11,861         United States           4,528

China, P.R.: Hong Kong   10,092         South Africa            4,079

Virgin Islands, British  9,661          Cayman Islands          3,856

Netherlands              8,705          Luxembourg              3,854

Luxembourg               6,552          United Arab Emirates    3,520

Note: The Coordinated Direct Investment Survey includes cross-border position data of Category 1 Global Business
Companies (GBC1s).

Source: IMF Website. For further information consult http://cdis.imf.org