
Page 22 - June 2017
P. 22
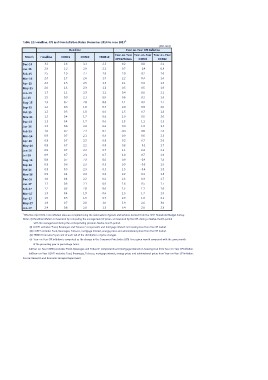
Table 12: Headline, CPI and Core Inflation Rates: December 2014 to June 20171

                                                                                    (Per cent)

                     Headline                    Year-on-Year CPI Inflation

Month Headline  CORE1  CORE2        TRIM10  Year-on-Year Year-on-Year Year-on-Year

                                            CPI Inflation CORE1                     CORE2

Dec-14  3.2     2.6            3.1  2.5     0.2                                0.8  2.1

Jan-15  2.8     2.2            2.9  2.2     0.7 -0.4 0.8

Feb-15  2.5     1.9            2.7  1.9     2.0                                0.2  1.6

Mar-15  2.4     1.7            2.6  1.7     2.2                                0.3  1.6

Apr-15  2.2     1.5            2.5  1.5     2.1                                0.3  1.6

May-15  2.0     1.3            2.3  1.3     0.5                                0.5  1.9

Jun-15  1.7     1.1            2.3  1.1     0.4                                0.6  2.1

Jul-15  1.5     0.9            2.1  0.9     0.6                                0.2  1.6

Aug-15  1.3     0.7            2.0  0.8     1.1                                0.4  1.7

Sep-15  1.2     0.6            1.9  0.7     2.0                                0.9  2.0

Oct-15  1.2     0.5            1.8  0.6     1.5                                0.7  1.8

Nov-15  1.2     0.4            1.7  0.6     1.0                                0.5  2.0

Dec-15  1.3     0.4            1.7  0.6     1.3                                1.1  2.3

Jan-16  1.3     0.6            2.0  0.6     0.4                                1.9  3.5

Feb-16  1.0     0.7            2.1  0.7 -0.5 0.9                                    2.8

Mar-16  0.9     0.7            2.1  0.8     0.9                                0.6  2.5

Apr-16  0.8     0.7            2.2  0.8     0.2                                0.7  2.6

May-16  0.8     0.7            2.2  0.8     0.8 -0.1 1.7

Jun-16  0.9     0.7            2.2  0.7     1.1                                0.4  2.3

Jul-16  0.9     0.7            2.3  0.7     1.0                                0.7  2.6

Aug-16  0.9     0.7            2.3  0.6     0.9 -0.4 1.8

Sep-16  0.8     0.6            2.3  0.5     0.9 -0.3 1.9

Oct-16  0.8     0.5            2.3  0.5     1.5 -0.4 1.8

Nov-16  0.9     0.4            2.3  0.6     2.2                                0.1  1.8

Dec-16  1.0     0.4            2.2  0.6     2.3                                0.3  1.7

Jan-17  1.1     0.3            2.1  0.6     1.8                                0.5  1.7

Feb-17  1.2     0.3            2.0  0.6     1.3                                1.1  1.6

Mar-17  1.3     0.4            1.9  0.6     1.3                                1.7  1.8

Apr-17  1.5     0.5            1.9  0.7     2.9                                1.9  2.1

May-17  1.9     0.7            2.0  1.0     5.9                                2.6  3.0

Jun-17  2.4     0.8            2.0  1.3     6.4                                2.0  2.3

1 Effective April 2013, Core inflation data are compiled using the new basket of goods and services derived from the 2012 Household Budget Survey.
Notes: (i) Headline inflation is measured by comparing the average level of prices, as measured by the CPI, during a twelve-month period

             with the average level during the corresponding previous twelve-month period.
        (ii) CORE1 excludes “Food, Beverages and Tobacco” components and mortgage interest on housing loan from the CPI basket.
        (iii) CORE2 excludes Food, Beverages, Tobacco, mortgage interest, energy prices and administered prices from the CPI basket.
        (iv) TRIM10 truncates 5 per cent of each tail of the distribution of price changes.
        (v) Year-on-Year CPI inflation is computed as the change in the Consumer Price Index (CPI) for a given month compared with the same month

            of the preceding year in percentage terms.
       (vi)Year-on-Year CORE1 excludes "Food, Beverages and Tobacco" components and mortgage interest on housing loan from Year-on-Year CPI inflation.
       (vii)Year-on-Year CORE2 excludes Food, Beverages, Tobacco, mortgage interest, energy prices and administered prices from Year-on-Year CPI inflation.
Source: Research and Economic Analysis Department.