
Page 26 - June 2017
P. 26
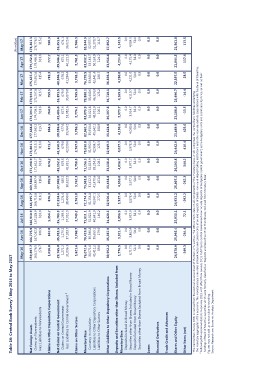
Table 16: Central Bank Survey1: May 2016 to May 2017                                                  Jul-16      Aug-16 Sep-16           Oct-16 Nov-16 Dec-16                Jan-17      Feb-17      Mar-17                     (Rs million)
                                                                                                                                                                                                                  Apr-17 May-17
                                                                                       May-16 Jun-16

Net Foreign Assets                                         159,897.7 166,725.9 166,910.9 166,395.7 169,580.8 171,298.9 173,801.3 177,668.6 174,394.9 174,924.3 175,637.2 179,152.6 178,461.3
  Claims on Nonresidents
  less: Liabilities to Nonresidents                        160,176.5 167,032.8 167,228.9 166,713.8 169,897.4 171,612.7 174,115.1 177,982.2 174,708.5 175,237.8 175,952.6 179,466.0 178,776.5

                                                           278.7       306.9                          318.0       318.1       316.6       313.9       313.8       313.7       313.6       313.5       315.4                                 313.3      315.2

Claims on Other Depository Corporations                    1,016.8     867.0 1,356.7                              876.3       902.9       874.2       871.7       884.5       764.9       759.5       783.3                                 777.7      780.3

Net Claims on Central Government                           -29,765.0 -35,913.5 -35,783.3 -37,224.6 -37,942.0 -41,152.2 -41,550.9 -38,386.6 -32,405.0 -35,191.5 -40,506.1 -39,546.2 -35,351.6

   Claims on Central Government                            1,271.2 1,270.2 1,269.6 1,274.4                                    680.2       679.3       679.8       677.6       677.6       679.3       678.2                                 675.1      674.1
    less: Liabilities to Central Government 2
                                                           31,036.3 37,183.7 37,052.9 38,499.0 38,622.2 41,831.5 42,230.6 39,064.2 33,082.6 35,870.8 41,184.4 40,221.3 36,025.6

Claims on Other Sectors                                    3,621.6 3,760.7 3,749.2 3,761.8 3,762.3 3,758.5 3,767.8 3,786.1 3,776.1 3,765.9 3,765.2 3,761.3 3,766.3

Monetary Base                                              76,072.6    70,419.8                       71,811.1    72,274.4    73,083.8    71,156.3    75,050.0    82,062.5    83,073.9    79,888.1    76,270.5    83,832.7                             83,944.9
   Currency in circulation                                  30,571.6    30,580.8                       31,022.9    31,154.8    31,412.2    31,813.9    31,992.0    35,918.4    34,021.8    33,440.6    33,640.4    33,183.7                             32,557.5
   Liabilities to Other Depository Corporations             45,411.2    39,659.1                       40,641.9    40,847.1    41,470.6    39,234.3    42,934.7    45,642.1    48,951.9    46,324.3    42,441.4    50,524.9                             51,270.7
   Liabilities to Other Sectors
                                                                 89.8       179.9                          146.2       272.5       201.0       108.1       123.3       501.9       100.1       123.2       188.7       124.2                                116.7

Other Liabilities to Other Depository Corporations         30,592.2 35,387.9 34,420.3 32,956.4 33,638.8 33,138.4 32,949.3 33,624.0 36,307.8 36,718.1 36,503.1 33,916.4 37,892.7

Deposits and Securities other than Shares, Excluded from   3,776.5     3,921.4                        3,996.9     3,937.4     4,036.0     4,036.7     4,037.3     4,150.6     3,973.7     4,169.6     4,280.0                               4,234.4    4,143.5
Monetary Base
                                                                 0.0         0.0                            0.0         0.0         0.0         0.0         0.0         0.0         0.0         0.0         0.0                                   0.0        0.0
   Deposits Included in Broad Money                         3,717.5     3,862.4                        3,937.9     3,878.4     3,977.1     3,977.7     3,978.3     4,091.6     3,914.7     4,110.7     4,221.0                               4,175.4    4,084.5
   Securities other than Shares Included in Broad Money
   Deposits Excluded from Broad Money                          58.1        58.1                           58.0        58.0        58.0        58.0        58.0        58.0         58.0       58.0         58.0                                  58.0      58.0
   Securities other than Shares Excluded from Broad Money        0.9         0.9                            0.9         0.9         0.9         0.9         0.9         0.9         0.9         0.9         0.9                                   0.9        0.9

Loans                                                      0.0 0.0 0.0 0.0 0.0 0.0 0.0 0.0 0.0 0.0 0.0 0.0 0.0

Financial Derivatives                                      0.0 0.0 0.0 0.0 0.0 0.0 0.0 0.0 0.0 0.0 0.0 0.0 0.0

Trade Credit and Advances

Shares and Other Equity                                    24,578.9 25,995.4 25,933.1 24,933.2 25,807.5 26,103.8 24,442.9 23,689.9 23,188.9 23,496.7 22,597.5 22,044.5 21,561.8

Other Items (net)                                          -249.3 -284.4                              72.1 -292.2 -262.3                  344.2       410.4       425.6       -13.5       -14.4       28.5                                  117.4      113.5

1 The Central Bank Survey (CBS) is derived from the sectoral balance sheet of the Bank of Mauritius. The CBS contains data on all components of the monetary base, which comprises the central bank liabilities underlying
 the monetary aggregates of the economy. The monetary base comprises all bank notes and coins in circulation and deposits of banks, non-bank deposit taking institutions and other non-depository corporations with the Bank of Mauritius.

2 Following IMF recommendations in January 2013, with effect from January 2010, liabilities to Central Government now include deposits of budgetary central government, extra-budgetary units and social security funds, as well as their

 holdings of Bank of Mauritius securities, which were formerly classified as "Deposits and Securities Other than Shares, Excluded from Monetary Base".

Figures may not add up to totals due to rounding.

Source: Research and Economic Analysis Department.