
Page 18 - June 2017
P. 18
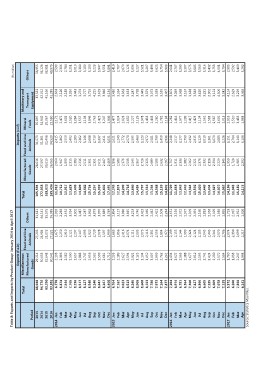
Table 8: Exports and Imports by Product Group: January 2014 to April 2017 (Rs million)
Exports (f.o.b) Imports (c.i.f) Others
Total Miscellaneous Food and Live Total Manufactured Food and Live Mineral Machinery and 36,955
Transport 38,126
Manufactured Animals Others 165,594 Goods Animals Fuels Equipment 38,981
172,038 32,553 40,979
Period Goods 31,631 168,023 42,012
64,141 165,436 41,160 2,599
2013 88,048 29,214 27,203 35,575 28,616 31,573 35,897 41,289 2,306
26,089 11,912 27,597 31,361 32,942 2,663 2,784
2014 94,776 30,635 24,984 10,712 30,019 32,496 25,367 2,126 3,251
2,910 13,017 26,065 34,523 22,580 2,188 3,010
2015 93,290 32,643 25,072 2,288 13,628 3,050 3,380
2,652 13,409 2,064 2,415 2,171 3,443 3,100
2016 83,851 30,541 27,221 3,054 14,809 1,947 1,862 2,471 3,274 3,100
3,302 14,642 1,890 2,553 3,602 3,777 3,223
2014 Jan 6,778 2,193 1,675 3,487 15,734 2,315 2,492 2,520 3,719 3,947
3,287 15,267 2,383 2,289 2,284 4,215 3,551
Feb 6,874 2,336 2,250 3,962 15,939 2,236 2,362 3,557 3,619 3,891
3,879 15,602 2,511 3,146 2,108 3,946 2,419
Mar 7,544 2,582 2,310 3,970 17,491 2,381 2,688 3,846 6,154 2,707
3,889 12,243 2,351 2,713 2,765 3,430 2,870
Apr 7,765 2,590 2,121 3,749 12,824 2,611 3,337 2,425 3,264 3,128
2,894 14,209 2,447 2,411 3,247 4,363 3,036
May 8,256 2,657 2,297 3,117 14,716 2,469 3,031 1,946 3,853 3,227
3,980 13,640 1,896 2,021 2,477 3,237 3,521
Jun 8,517 2,883 2,147 3,845 14,484 2,580 2,249 2,024 3,798 3,207
3,213 15,797 2,376 2,772 1,828 3,449 3,496
Jul 8,127 2,747 2,093 3,740 13,316 2,533 2,570 2,632 3,379 3,625
3,423 13,284 2,545 2,595 2,227 3,073 3,754
Aug 8,540 2,656 1,922 3,065 14,348 2,867 2,463 2,129 3,058 3,988
2,442 15,185 2,726 3,123 2,978 3,559 2,641
Sep 9,140 2,532 2,729 2,421 14,802 2,323 2,972 1,435 3,407 2,767
2,508 11,729 2,689 2,581 1,445 3,801 3,290
Oct 8,647 2,599 2,078 2,244 11,858 2,586 2,799 2,280 3,249 3,207
2,651 13,845 2,632 3,459 1,781 3,068 3,575
Nov 8,167 2,681 1,597 2,192 12,445 2,287 2,936 2,184 3,167 3,685
2,072 14,384 1,757 2,248 1,282 3,638 3,569
Dec 8,400 2,712 1,939 1,977 13,592 1,911 2,517 1,414 3,348 3,316
2,399 15,020 2,333 3,177 1,977 3,820 3,432
2015 Jan 6,764 2,205 1,665 2,491 13,449 1,982 2,790 1,299 3,221 3,753
2,160 13,404 2,262 2,492 2,417 2,902 4,001
Feb 7,162 2,189 1,856 1,883 14,827 2,321 2,815 1,423 3,123 3,794
2,358 16,022 2,378 3,129 2,124 4,506 2,903
Mar 9,023 2,627 2,416 2,029 15,062 2,332 3,019 1,561 3,582 2,592
1,936 14,186 2,126 3,361 1,583 4,124 3,400
Apr 8,513 2,594 2,074 1,865 11,943 2,294 3,070 2,587 2,329 3,292
1,718 15,182 2,229 2,685 2,601 3,219
May 8,245 2,921 2,111 2,097 14,175 2,145 3,226 2,315 3,468
2,912 1,953 3,151 2,055
Jun 8,908 3,135 2,033 1,926 1,728 2,784 2,510
1,985 3,140 3,438
Jul 8,600 3,104 2,073 2,292 3,130 1,993
Aug 8,233 3,052 2,116
Sep 7,780 3,007 2,331
Oct 7,973 2,999 2,553
Nov 7,164 2,762 1,894
Dec 7,477 3,261 1,972
2016 Jan 7,194 2,404 2,139
Feb 6,974 2,627 2,155
Mar 6,781 2,565 2,144
Apr 6,364 2,388 1,999
May 7,400 2,677 2,324
Jun 7,427 2,812 2,124
Jul 6,860 2,595 2,105
Aug 6,669 2,741 2,045
Sep 7,225 2,424 2,443
Oct 6,609 2,239 2,341
Nov 7,078 2,572 2,570
Dec 7,135 2,534 2,736
2017 Jan 5,572 1,780 2,074
Feb 6,260 1,833 2,330
Mar 7,858 2,247 2,699
Apr 6,141 1,998 2,217
Source: Statistics Mauritius.