
Page 46 - May 2017
P. 46
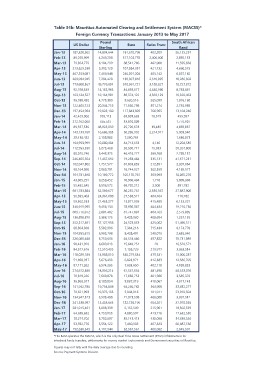
Table 34b: Mauritius Automated Clearing and Settlement System (MACSS)*
               Foreign Currency Transactions: January 2013 to May 2017

Jan-13  US Dollar     Pound          Euro                      Swiss Franc  South African
Feb-13                Sterling                                                    Rand
Mar-13  187,320,502  14,894,644  181,670,798                      402,209
Apr-13  89,250,999   4,249,208   317,103,778                     2,400,000     26,155,257
May-13  79,364,775   6,184,299   88,541,706                       402,000       2,865,133
Jun-13  213,829,538  5,313,120   107,384,937                      421,732      11,595,668
Jul-13  467,253,081  7,400,948   246,091,204                      405,142       4,660,575
Aug-13  209,094,945  7,284,420   138,307,816                     2,610,095      6,057,182
Sep-13  773,600,367  49,776,804  340,361,721                     3,189,927     18,286,302
Oct-13  92,768,349   14,132,965  34,393,677                      4,640,560     10,727,872
Nov-13  163,124,527  10,164,981  86,374,122                      4,369,129      8,783,081
Dec-13  96,938,430   4,773,380                                    205,099      10,320,463
Jan-14  122,406,723  20,344,755   9,620,516                       301,274       1,976,160
Feb-14  197,454,964  19,022,130  71,856,798                       766,965       2,735,985
Mar-14  42,429,002    359,113    117,843,309                                   13,104,246
Apr-14  212,162,066   655,537    63,003,683                        18,319        455,997
May-14  89,557,336   48,922,059  33,810,009                            -        1,776,907
Jun-14  143,133,760  16,686,333  25,720,678                                     4,669,867
Jul-14  29,430,452   2,158,982   50,286,992                        19,485       5,903,540
Aug-14  164,953,999  10,080,334   7,260,734                      2,214,911      1,630,073
Sep-14  112,953,390  3,273,468   34,713,653                                    12,204,585
Oct-14  80,015,746   5,443,375   26,500,771                            -       20,267,800
Nov-14  246,405,564  11,457,692  46,418,277                         4,146       2,785,137
Dec-14  102,047,802  1,757,577   19,283,464                        15,033      41,571,231
Jan-15  98,164,090   2,960,701   67,003,839                       599,268       2,307,064
Feb-15  164,781,840  10,189,772  16,744,927                       335,131       4,165,577
Mar-15  43,965,291   9,259,452   105,170,761                      212,891      10,065,276
Apr-15  55,482,645   6,516,572   10,908,494                       302,359       5,009,398
May-15  681,783,884  52,389,677  69,702,212                       503,993        891,782
Jun-15  56,695,403   24,361,080  86,235,761                         1,718      27,887,906
Jul-15  59,362,533   21,463,277  27,538,571                         2,000        710,782
Aug-15  340,915,995  9,458,134   13,871,059                      2,630,567      6,133,321
Sep-15  609,776,072  2,801,482   78,990,387                       404,764      19,210,750
Oct-15  136,898,870  5,388,175   81,747,801                       415,489       2,579,895
Nov-15  252,217,891  37,127,936   9,428,930                       404,484       1,257,135
Dec-15  68,864,369   5,502,996   24,523,853                       404,769      51,490,311
Jan-16  104,955,815  6,983,788    7,384,218                       408,694       8,174,770
Feb-16  226,086,488  6,750,636    8,428,491                       425,062       2,635,640
Mar-16  90,431,920   6,689,813   64,318,486                       715,434      70,731,889
Apr-16  84,577,616   12,510,435  15,640,251                       240,076      16,520,571
May-16  118,029,189  14,938,010   7,158,729                       497,822       3,863,514
Jun-16  51,058,957   5,676,433   340,279,334                                   15,006,287
Jul-16  87,171,022   6,574,265    6,823,971                           20       12,586,705
Aug-16  274,612,388  18,356,214   7,603,650                       219,977       4,059,033
Sep-16  70,819,226   7,660,878   61,567,654                       479,531      48,553,076
Oct-16  36,860,017   8,189,854   17,666,753                       412,383       3,585,376
Nov-16  141,942,780  19,754,888   9,887,319                       402,110       4,317,143
Dec-16  70,621,993   10,376,135  64,260,782                       481,498      33,832,277
Jan-17  134,947,323  5,593,400    5,044,016                       401,966      23,910,504
Feb-17  241,538,997  15,453,663  21,923,598                       410,067       3,997,512
Mar-17  281,015,461  3,008,339   132,758,196                      563,900      27,970,058
Apr-17  64,638,632   4,759,053    6,152,549                       101,011      18,302,359
May-17  78,274,702   5,782,697    4,880,597                       400,000      17,652,530
        53,592,776   5,554,122   35,143,413                       654,201      34,636,526
        192,636,349  4,117,944    7,460,502                       215,961      66,887,556
                                 52,567,561                       413,716       2,045,501
                                                                  430,098
                                                                  407,323
                                                                  400,062

*The BoM operates the MACSS, which is the only Real Time Gross Settlement (RTGS) infrastructure for
interbank funds transfers, settlements for money market instruments and Government securities in Mauritius.

Figures may not tally with the daily average due to rounding.
Source: Payment Systems Division.