Page 50 - May 2017
P. 50

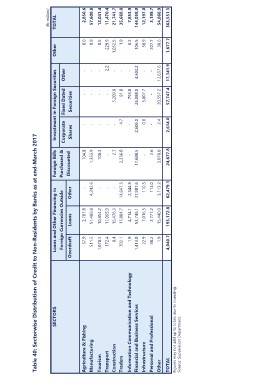
Table 40: Sectorwise Distribution of Credit to Non-Residents by Banks as at end-March 2017

SECTORS                                            Loans and Other Financing in    Foreign Bills  Investment in Foreign Securities  Other      (Rs million)
                                                    Foreign Currencies Outside     Purchased &
                                                                                   Discounted                                                 TOTAL

                                                                                                  Corporate Fixed Dated Other

                                                   Overdraft Loans       Other                    Shares    Securities

Agriculture & Fishing                                 37.9      2,707.8        -      104.8            -          -           -          0.0     2,850.6
Manufacturing                                        511.5    51,489.8    4,242.6   1,355.9            -          -           -          0.9   57,600.8
                                                   1,078.5    10,854.2                                 -          -           -          0.5   12,041.4
Tourism                                              172.4    11,065.9         -      108.3            -          -            2.2    229.9    11,470.4
Transport                                                     15,476.3         -         -             -     5,209.8          -     1,052.5    21,741.7
Construction                                            0.4   17,884.7         -          2.7          4.7       91.8         -          1.9   35,668.8
Traders                                              702.1               14,647.5
                                                                4,714.1             2,336.0            -       793.0          -          0.2     7,853.9
Information Communication and Technology                1.9   53,746.1    2,344.8                 2,606.0   26,088.0     4,502.2      106.5   144,058.0
Financial and Business Services                    1,413.0               37,907.6        -
Infrastructure                                                  7,016.5            17,688.5            0.8   5,007.7          -        38.9    12,197.0
Personal and Professional                             22.9      2,777.2     110.3                      -          -           -       207.7      3,199.7
Other                                                 98.2    15,440.0      113.0        -             2.4              12,637.6
                                                                          3,113.2         3.6               20,557.2                   38.6    54,868.9
TOTAL                                                   1.9  193,172.8              3,078.0       2,614.0               17,141.9
                                                                         62,479.1                           57,747.4                1,677.7   363,551.3
Figures may not add up to totals due to rounding.  4,040.7                         24,677.8
Source: Supervision Department.
   45   46   47   48   49   50   51   52   53   54   55