
Page 51 - May 2017
P. 51
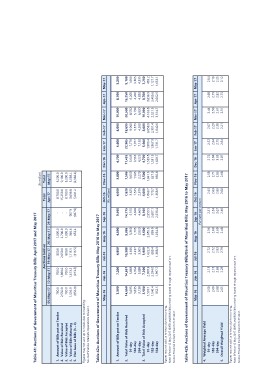
Table 41: Auctions of Government of Mauritius Treasury Bills: April 2017 and May 2017                                 Total              (Rs million)
                                                                                                                     Apr-17                 Total
                                                                                          Auctions held on
                                                         05-May-17 12-May-17 19-May-17 26-May-17 29-May-17                                May-17

1. Amount of Bills put on Tender                     700.0     700.0     800.0                     1,000.0     -      8,700.0            3,200.0
2. Value of Bids Received                          2,550.0   1,800.0   2,050.0                     2,700.0     -     15,250.0            9,100.0
3. Value of Bids Accepted                                                                          1,000.0     -                         3,200.0
4. Value of Bills Maturing                           700.0     700.0     800.0                              907.9     8,700.0            5,538.4
5. Net Issue of Bills (3 - 4)                      1,556.9   1,613.5   1,113.5                       346.6  (907.9)   3,698.8            (2,338.4)
                                                    (856.9)   (913.5)   (313.5)                      653.4            5,001.2

Figures may not add up to totals due to rounding.
Source:Financial Markets Operations Division.

Table 42a: Auctions of Government of Mauritius Treasury Bills: May 2016 to May 2017

                                  May-16                     Jun-16    Jul-16                      Aug-16   Sep-16   Oct-16 Nov-16                     Dec-16   Jan-17   Feb-17 Mar-17 Apr-17 May-17
                                                                                                                     (Rs million)

1. Amount of Bills put on Tender                   3,900     7,200                          4,800   4,600    9,500               4,000    3,800        4,700 5,600 8,000 10,000 8,700 3,200

2. Total Value of Bids Received                    14,660    14,691    10,388                       9,085   14,775               7,820    7,505        11,435   22,905   18,695   20,500   15,250    9,100
         91-day                                      5,695     5,868     4,646                       5,360    5,510               3,625    3,650         3,645    7,778    9,060    8,550    6,200    1,600
        182-day                                      5,835     4,934     2,437                       1,705    4,600               1,525    1,585         3,565    7,977    5,375    5,130    4,200    3,165
        364-day                                      3,130     3,889     3,305                       2,020    4,665               2,670    2,270         4,225    7,150    4,260    6,820    4,850    4,335
                                                    3,900     7,200     3,900                       4,600    8,100               4,000    3,500         4,700    5,600    8,000             8,700    3,200
3. Total Value of Bids Accepted                                                                    2,685.3                      1,860.7  1,841.3                                  10,000              439.2
         91-day                                    1,507.1   2,908.3   1,622.3                       859.9  2,959.5               770.7    827.9       1,539.8  1,900.4  3,858.0  4,163.8  3,636.9  1,127.7
        182-day                                    1,540.4   2,294.0     889.4                     1,054.8  2,607.1             1,368.6    830.8       1,531.5  1,967.9  2,301.4  2,521.5  2,400.6  1,633.1
        364-day                                              1,997.7                                        2,533.4                                    1,628.7  1,731.7  1,840.6  3,314.7  2,662.5
                                                     852.5             1,388.3

Figures may not add up to totals due to rounding.
Note: Effective 12 May 2017 GMTB and BOM Bills are being issued through separate auctions.
Source: Financial Markets Operations Division.

Table 42b: Auctions of Government of Mauritius Treasury Bills/Bank of Mauritius Bills: May 2016 to May 2017

                                  May-16                     Jun-16    Jul-16                      Aug-16   Sep-16   Oct-16              Nov-16 Dec-16 Jan-17 Feb-17 Mar-17 Apr-17 May-17

                                                                                                            Per cent per annum

4. Weighted Average Yield                          2.50 2.13 2.72 2.36 2.21 2.43 2.58 2.72 2.52 2.07 2.44 2.68 2.04
         91-day                                    2.66 2.15 2.72 2.60 2.54 2.63 2.71 2.84 2.64 2.29 2.50 2.75 2.13
        182-day                                    2.88 2.68 2.93 2.69 2.67 2.80 2.85 3.05 2.75 2.38 2.61 2.82 2.25
        364-day                                    2.65 2.29 2.79 2.48 2.46 2.60 2.68 2.87 2.64 2.21 2.51 2.75 2.12

5. Overall Weighted Yield

Figures may not add up to totals due to rounding.
Note: Effective 12 May 2017 GMTB and BOM Bills are being issued through separate auctions.
Source: Financial Markets Operations Division.