Page 64 - May 2017
P. 64

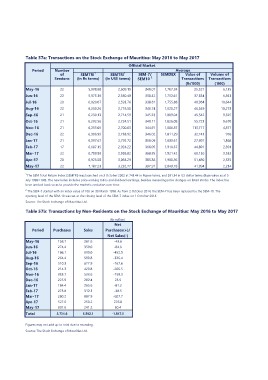
Table 57a: Transactions on the Stock Exchange of Mauritius: May 2016 to May 2017

                                                           Official Market

     Period  Number      SEMTRI1                  SEMTRI1           SEM-7/              Average             Volume of
                 of                                                 SEM10 2  SEMDEX Value of               Transactions
May-16                   (in Rs terms) (in US$ terms)
Jun-16       Sessions                                                                        Transactions      ('000)
Jul-16
Aug-16           22                                                                             (Rs'000)               6,135
Sep-16           22
Oct-16           20      5,998.88                 2,609.19          340.07   1,767.24  25,521
Nov-16           22      5,973.36                 2,580.48          338.42
Dec-16           21      6,020.07                 2,593.76          338.81   1,752.61  37,634              6,851
Jan-17           21      6,259.26                 2,718.50          348.74
Feb-17           21      6,230.13                 2,714.59          345.23   1,755.88  48,984              10,644
Mar-17           22      6,292.56                 2,724.51          349.11
Apr-17           21      6,253.05                 2,700.03          344.91   1,820.27  46,549              10,273
May-17           17      6,306.99                 2,738.92          346.02
                 22      6,397.67                 2,795.72          350.09   1,809.04  45,542              9,325
                 20      6,667.15                 2,924.22          366.05
                 22      6,709.98                 2,958.82          368.85   1,826.08  55,723              9,670
                         6,925.58                 3,064.29          383.38
                         7,187.23                 3,232.77          397.91   1,806.87  113,717             4,877

                                                                             1,811.29  32,743              976

                                                                             1,833.61  27,991              1,368

                                                                             1,910.37  44,891              2,891

                                                                             1,921.42  68,156              3,532

                                                                             1,980.86  51,450              2,535

                                                                             2,049.78  41,994              2,234

1 The SEM Total Return Index (SEMTRI) was launched on 3 October 2002 at 743.44 in Rupee terms, and 391.34 in US dollar terms (Base value as at 5
July 1989=100). The new index includes price earning ratios and dividend earnings, besides measuring price changes on listed stocks. The index has
been worked back so as to provide the market's evolution over time.

2 The SEM-7 started with an index value of 100 on 30 March 1998. As from 2 October 2014, the SEM-7 has been replaced by the SEM-10. The
opening level of the SEM-10 was set at the closing level of the SEM-7 index on 1 October 2014.

Source: The Stock Exchange of Mauritius Ltd.

Table 57b: Transactions by Non-Residents on the Stock Exchange of Mauritius: May 2016 to May 2017

     Period  Purchases   Sales                        (Rs million)

May-16           158.7    201.6                          Net
Jun-16           274.4    359.0                   Purchases(+)/
Jul-16           186.1    639.0
Aug-16           264.4    590.8                    Net Sales(-)
Sep-16           510.3    677.9                          -43.0
Oct-16           214.3    420.8                          -84.6
Nov-16           333.7    533.6                         -452.9
Dec-16           225.9    202.4                         -326.4
Jan-17           184.4    265.6                         -167.6
Feb-17           273.8    312.3                         -206.5
Mar-17           280.2    887.9                         -199.9
Apr-17           527.0    250.2                           23.5
May-17           301.6    241.2                          -81.2
Total           3,734.6  5,582.1                         -38.5
                                                        -607.7
                                                         276.8
                                                          60.4

                                                        -1,847.5

Figures may not add up to total due to rounding.
Source: The Stock Exchange of Mauritius Ltd.
   59   60   61   62   63   64   65   66   67   68   69