Page 9 - May 2017
P. 9

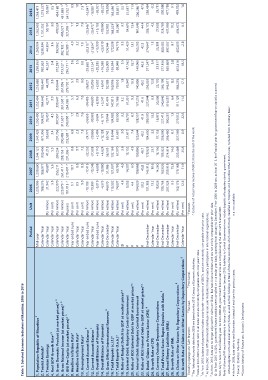
Table 1: Selected Economic Indicators of Mauritius: 2006 to 2016

                                                                                                        Period                         Unit   2006  2007  2008               2009               2010  2011               2012            2013          2014         2015          2016

1. Population-Republic of Mauritius 1                                                                   Mid-year                             1,233,996 1,239,630 1,244,121 1,247,429 1,250,400 1,252,404 1,255,882                      1,258,653     1,260,934     1,262,605     1,263,473
2. Tourist Arrivals*                                                                                    Calendar Year                                                                                                                     992,503     1,038,334     1,151,252
3. Tourism Earnings                                                                                     Calendar Year                         788,276 906,971 930,456 871,356 934,827 964,642 965,441                                                                              1,275,227
4. Real GDP Growth Rate* 5                                                                              Calendar Year                                                                                                                      40,557        44,304         50,191        55,867
5. Gross Domestic Product (at market prices)* 5                                                         Calendar Year    (Rs million)         31,942 40,687 41,213 35,693 39,457 42,717 44,378                                                  3.4           3.6            3.0          3.5 2
6. Gross National Income (at market prices)* 5                                                          Calendar Year    (Per cent)
7. GNI Per Capita (at market prices)* 5                                                                 Calendar Year    (Rs million)         5.6 5.6 5.3 3.4 4.5 3.9 3.6                                                                 372,397       392,062        409,524      434,188 2
8. Headline Inflation Rate*                                                                             Year ended June  (Rs million)                                                                                                   373,127 ^     382,132 ^     406,527 ^     431,889 ^2
                                                                                                        Calendar Year    (Rupees)             222,870 255,211 284,254 291,756 307,957 330,647 350,644                                   296,171 ^     302,989 ^     321,905 ^     341,752 ^2
9. Headline Inflation Rate*                                                                             Calendar Year    (Per cent)
                                                                                                        Year ended June  (Per cent)          223,879 ^ 261,411 ^ 288,155 ^ 290,489 ^ 311,637 ^ 331,550 ^ 351,836 ^                               3.6           4.0           1.7            0.9
10. Unemployment Rate*                                                                                  Calendar Year    (Per cent)                                                                                                              3.5           3.2           1.3
11. Current Account Balance 7                                                                           Year ended June  (Rs million)        181,013 ^ 210,497 ^ 231,306 ^ 232,593 ^ 249,030 ^ 264,365 ^ 279,792 ^                              8.0           7.8            7.9            1.0
12. Current Account Balance 7                                                                           Calendar Year    (Rs million)                                                                                                    -29,698 2     -20,315 2     -23,346 2            7.3 3
13. Overall Balance of Payments                                                                         End-December     (Rs million)         5.1 10.7                       8.8 6.9 1.7 5.1 5.1                                         -23,124 2     -21,824 2     -20,472 2      -16,047 3
                                                                                                        Calendar Year    (Rs million)                                                                                                    +20,335        +15,939       +15,105       -18,881 3
14. Overall Balance of Payments                                                                         Calendar Year    (Rs million)         8.9 8.8 9.7 2.5 2.9 6.5 3.9                                                                +16,580        +23,019       +19,960        +26,921
15. Gross Official International Reserves 8                                                             @                (Rs million)                                                                                                    105,009        124,344       152,902
16. Total Imports (c.i.f.)*                                                                             #                (Rs million)         9.0 8.5 7.2 7.3 7.6 7.8 8.0                                                                 165,594        172,038      168,0232       +26,227
                                                                                                        #                (Per cent)                                                                                                        88,048         94,776       93,2902
17. Total Exports (f.o.b.)*                                                                             #                (Rs million)         -10,188 -17,415 -22,232 -24,771 -24,655 -34,405 -36,021                                            3.5           3.3           3.7      178,858
                                                                                                        #                (Per cent)                                                                                                         47,162        51,429        54,676      165,436 3
18. Ratio of Budget Deficit to GDP at market prices**                                                   End-December     (Rs million)         -19,399 -13,248 -27,633 -20,836 -30,985 -44,630 -25,059                                          12.7           13.1          13.4
                                                                                                        Calendar Year    (Per cent)                                                                                                       149,960        165,285       181,649       83,851 3
19. External Debt: Budgetary Central Government                                                         End-December     (Rs million)         -3,019 +6,603 +9,110 +2,484 +9,694 +8,399 +2,692                                                40.3          42.2            44.4          3.5 2
                                                                                                        End-December     (Per cent)                                                                                                       271,247        274,647       286,172
20. Ratio of BCG External Debt to GDP at market prices**                                                End-December     (Rs million)         -4,573 +13,880 +4,624 +12,103 +6, 177 +5,247 +6,041                                                5.9           1.3           4.2     51,637 2
                                                                                                        Calendar Year    (Rs million)                                                                                                       23,317        25,391        27,638             11.9
21. Internal Debt: Budgetary Central Government                                                         End-December     (Rs million)         44,670 51,386 56,535 69,742 79,044 81,474 92,988                                            277,356        300,582       323,789
                                                                                                        Calendar Year    (Per cent)                                                                                                       365,609        397,557       437,999      206,280 2
22. Ratio of BCG Internal Debt to GDP at market prices**                                                                 (Rs million)         115,502 121,037 132,165 118,444 134,882 147,815 160,996                                            5.8           8.7          10.2           47.5
23. Banks' Claims on Private Sector (CPS) 6                                                                              (Per cent)                                                                                                       413,416        402,035       434,672
24. Growth Rate of CPS                                                                                                                        74,037 69,708 67,970 61,681 69,550 73, 586 79,658                                                13.5           -2.8           8.1      285,484

25. Currency Outside Depository Corporations                                                                                                  4.8 4.0 2.6 3.0 3.2 3.2                                                              1.8                                                     -0.2
26. Total Private Sector Rupee Deposits with Banks 6                                                                                                                                                                                                                                   29,731
27. Broad Money Liabilities (BML)                                                                                                             9,255 14,207 13,152 21,617 26,791 31,351 35,947
28. Growth Rate of BML                                                                                                                                                                                                                                                                350,580
29. Claims on Other Sectors by Depository Corporations 9                                                                                      4.4 6.0 4.9 7.4 8.7 9.5 10.3
30. Growth Rate of Claims on Other Sectors by Depository Corporations 9                                                                                                                                                                                                               477,789
                                                                                                                                              104,829 108,668 109,836 125,644 128,557 137,219 140,806                                                                                       9.1

                                                                                                                                              50.2 45.8 40.7 43.2 41.9 41.6 40.2                                                                                                      439,052

                                                                                                                                              131,333 145,312 178,925 184,650 209,570 227,044 256,025                                                                                       1.0

                                                                                                                                              13.2 10.6 23.1                 3.2 13.5                                    8.3 12.8

                                                                                                                                              13,028 14,260 16,156 17,153 18,975 20,308 22,170

                                                                                                                                              139,733 162,026 185,322 206,890 227,415 240,640 266,199

                                                                                                                                              207,523 239,318 274,314 296,480 300,231 319,537 345,617

                                                                                                                                              9.5 15.3 14.6 8.1 1.3 6.4 8.2

                                                                                                                                              160,176 179,168 225,468 227,569 279,012 311,129 364,274

                                                                                                                                              12.6 11.9 25.8                 0.9 22.6 11.5 17.1

1 Excluding Agalega and Saint Brandon.  2 Revised.       3 Provisional.                                                  4 Forecast.

5 The National Accounts data from 2006 are based on the 2013 Census of Economic Activities.                              ^ Exclusive of net primary income of GBC1s from the rest of the world

6 Data as from 2005 onwards refer to all banks and are not strictly comparable with prior years' data.

7 As from 2010, balance of payments includes cross-border transactions of GBC1s and are not strictly comparable with prior data.

8 As from 2007, Gross Official International Reserves exclude the Bank's foreign equity participation in international organisations.

9 As from 2010, data are no longer adjusted for claims on Global Business Licence holders and are not strictly comparable with prior data.

@ As from 2010 to 2014, government finance statistics were compiled on a calendar year basis, spanning from January to December. From 2006 to 2009 and as from 2015, the financial year for government finance statistics spanned

from July to June of the following year. As from 2008-09, government finance statistics are compiled using the IMF's GFS Manual 2001.

Note: Following IMF recommendations in January 2013, with effect from January 2010, liabilities to Central Government now include deposits of budgetary central government,

extra-budgetary units and social security funds, as well as their holdings of Bank of Mauritius securities, which were formerly classified as "Deposits and Securities Other than Shares, Excluded from Monetary Base".

# As from 2009, data refer to end-December, instead of end-June for previous years.                                      n.a.: not available

* Source: Statistics Mauritius.

**Source: Ministry of Finance and Economic Development.
   4   5   6   7   8   9   10   11   12   13   14