
Page 13 - May 2017
P. 13
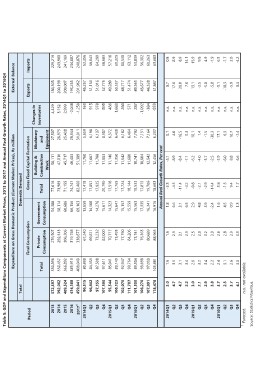
Table 5: GDP and Expenditure Components at Current Market Prices, 2013 to 2017 and Annual Real Growth Rates, 2014Q1 to 2016Q4

                               Expenditure on Gross Domestic Product (Current Market Prices), Rs million                   External Balance

                 Total                                     Domestic Demand

     Period                             Final Consumption               Gross Fixed Capital Formation                      Exports   Imports

          2013                 Total        Private        Government   Total   Building &   Machinery    Changes in
          2014                          Consumption        Consumption         Construction       and     Inventories
          2015
          2016                                  276,507                             Work     Equipment             4,429
         20171                                  292,343                                                            3,152
      2014Q1     372,397       330,896          306,206    54,388 77,618       50,111          27,507              2,999   180,305   229,219
                 392,062       350,457          319,758                                                           -2,048   200,198   243,980
             Q2  409,524       366,892          338,877    58,114 73,989       47,016          26,973             -1,258   200,007   241,189
             Q3  434,188       385,913                                                                                     193,255   234,087
             Q4  459,841       408,040            67,240   60,686 71,155       45,717          25,438                 363  201,962   248,876
      2015Q1                                      69,871                                                             915
             Q2   90,515        80,899            73,232   66,156 74,747       46,403          28,344                978    45,257    52,356
             Q3   96,802        84,439            82,000                                                             895    51,150    58,643
             Q4   97,155        87,508            70,717   69,163 82,400       51,389          31,011                486    51,016    64,299
      2016Q1     107,590        97,611            73,493                                                           1,683    52,776    68,683
             Q2   95,544        85,041            77,790   13,659 17,419       11,760          5,659                 260    49,280    57,218
             Q3  100,123        89,140            84,206                                                             571    50,537    60,329
             Q4  102,070        92,947            73,741   14,568 17,857       11,667          6,190                 287    48,717    60,530
                 111,787        99,764            76,363                                                         -1,092     51,474    63,112
      2014Q1     101,550        89,304            80,689   14,276 17,925       11,788          6,137                -384    49,363    53,839
             Q2  106,270        93,698            88,965                                                            -859    45,677    56,302
             Q3  107,891        97,030                     15,611 20,790       11,803          8,987                        46,328    60,263
             Q4  118,476       105,881                1.6                                                           n.a.    51,887    63,683
                                                      2.9  14,323 17,518       11,146          6,372                n.a.
      2015Q1                                          3.1                                                           n.a.        0.7       0.8
             Q2                                       2.9  15,647 17,769       11,350          6,420                n.a.      17.0        8.9
             Q3                                       2.5                                                           n.a.      20.0        8.9
             Q4                                       2.9  15,157 17,724       11,542          6,182                n.a.                14.1
                                                      3.2                                                           n.a.        7.0     15.9
      2016Q1                                          3.0  15,559 18,144       11,680          6,464                n.a.      13.1        9.8
             Q2                                       2.6                                                           n.a.      -2.5        4.9
             Q3                                       2.8  15,563 18,533       10,741          7,792                n.a.      -5.8      -1.9
             Q4                                       2.9                                                           n.a.      -5.8        6.5
                                                      3.3  17,335 17,815       10,664          7,151                n.a.      -5.1      -1.7
1 Forecast.                                                                                                                  -10.3        2.0
                                                           16,341 19,706       12,542          7,164                          -5.9      -4.2

                                                           16,916 18,693       12,456          6,237                            0.3

                                                           Annual Real Growth Rates, Per cent

                      3.0 1.6                              1.8 -3.3            -5.1 0.1
                      4.7 3.5
                      4.7 3.1                              6.6 -4.5            -8.9 4.6
                      2.2 3.4
                      3.0 2.6                              3.1 -11.4           -8.4 -16.5
                      2.1 3.2
                      2.9 3.4                              6.5 -4.2            -7.1 0.3
                      3.8 2.2
                      3.7 2.4                              2.9 -0.8            -6.2 10.1
                      2.3 3.1
                      3.7 2.6                              4.8 -2.1            -4.0 1.4
                      4.1 3.0
                 n.a.: not available.                      3.9 -2.9            -3.7 -1.5

                                                           -2.4 -14.4          -2.5 -30.3

                                                           1.6 3.8             -3.9 17.1

                                                           4.5 -1.5            -6.0 6.3

                                                           0.9 9.4             8.8 10.7

                                                           1.3 1.7             6.6 -7.4

Source: Statistics Mauritius.