
Page 14 - May 2017
P. 14
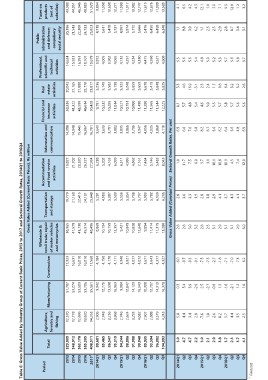
Table 6: Gross Value Added by Industry Group at Current Basic Prices, 2013 to 2017 and Sectoral Growth Rates, 2014Q1 to 2016Q4
Gross Value Added (Current Basic Prices), Rs million
Period Agriculture, Wholesale & Transportation Accommodation Financial and Real Professional, Public Taxes on
Manufacturing retail trade; repair and storage and food service Information and scientific and administration products
Total Construction and defence; (net of
forestry and of motor vehicles activities insurance estate technical subsidies)
fishing and motorcycles communication activities compulsory
social security
activities activities
2013 329,009 12,570 51,787 17,923 38,965 19,779 19,827 14,398 38,336 20,042 14,624 20,196 43,388
2014 348,012 12,778 53,274 16,631 41,579 21,160 21,702 14,948 41,322 21,165 15,923 21,543 44,051
2015 363,178 12,696 53,503 16,018 43,738 22,415 23,520 15,445 43,599 21,888 16,953 22,309 46,346
2016 385,305 13,620 53,706 16,018 45,914 24,131 26,727 16,067 46,614 22,770 18,107 24,733 48,883
20171 408,511 14,265 55,561 17,568 48,496 25,648 27,924 16,701 50,428 23,817 19,679 25,823 51,329
2014Q1
80,681 2,906 9,942 4,184 8,869 5,281 6,238 3,643 9,791 5,236 3,872 4,718 9,834
Q2 85,465 2,748 12,770 4,158 10,194 4,983 5,202 3,633 10,232 5,149 4,005 5,611 11,338
Q3 86,547 3,256 13,598 4,178 10,159 5,387 4,163 3,791 10,285 5,582 3,982 5,478 10,608
Q4 95,319 3,868 16,963 4,111 12,357 5,509 6,099 3,882 11,014 5,198 4,065 5,737 12,271
2015Q1 84,244 2,746 3,948 5,556 6,511 3,835 10,527 5,322 4,132 4,897 11,300
Q2 88,806 2,624 9,984 3,921 9,421 5,354 4,986 3,866 10,781 5,248 4,257 5,974 11,317
Q3 91,088 3,293 12,847 4,077 10,849 5,708 4,862 3,796 10,800 5,659 4,234 5,772 10,982
Q4 99,040 4,032 14,129 4,072 10,820 5,797 7,161 3,947 11,490 5,659 4,330 5,666 12,747
2016Q1 89,935 2,907 16,543 3,671 12,648 5,983 7,454 4,056 11,280 5,678 4,415 5,476 11,615
Q2 93,594 2,888 10,308 3,643 5,782 5,746 4,025 11,565 5,419 4,558 6,450 12,676
Q3 96,882 3,579 12,707 4,377 9,894 6,159 5,483 3,868 11,544 5,848 4,527 6,458 11,009
Q4 104,893 4,245 14,313 4,327 11,414 6,206 8,043 4,118 12,225 5,825 4,608 6,348 13,583
16,378 11,319
13,288
Gross Value Added (Constant Prices) - Sectoral Growth Rates, Per cent
2014Q1 3.0 5.0 0.3 -6.0 2.8 2.8 1.0 6.9 6.1 3.3 5.5 1.1 4.1
Q2 4.7 4.4 5.4 -9.7 2.8 3.6 11.7 6.0 5.7 4.6 5.6 9.8 6.5
Q3 4.7 3.4 3.9 -9.3 3.0 3.3 7.5 7.0 4.8 16.9 5.6 3.9 4.2
Q4 2.2 2.8 -2.0 -9.1 3.2 1.9 6.0 5.8 5.4 -3.1 5.4 6.2 4.3
2015Q1 3.0 -7.6 2.5 -7.5 2.8 2.8 9.7 8.2 4.6 2.3 4.8 1.1 12.1
Q2 2.1 1.0 -2.7 -7.5 2.5 3.8 3.1 8.7 5.0 2.4 5.0 2.5 1.8
Q3 2.9 2.6 -0.8 -2.7 3.1 2.9 10.1 5.0 5.5 1.7 5.2 2.5 7.0
Q4 3.8 0.2 1.5 -1.8 2.9 4.1 10.8 6.2 5.7 9.8 5.3 -2.9 7.1
2016Q1 3.7 5.7 -1.6 -7.1 3.1 3.7 10.9 6.4 5.8 6.4 5.7 2.8 5.5
Q2 2.3 4.4 -2.1 -7.0 3.1 4.3 4.5 5.6 5.7 3.2 5.6 0.7 12.8
Q3 3.7 3.5 1.2 7.3 2.9 4.1 7.4 4.8 5.6 3.2 5.8 3.4 1.2
Q4 4.1 2.5 1.6 6.2 3.0 3.7 12.0 6.9 5.6 2.6 5.7 3.1 3.2
1 Forecast