
Page 30 - June 2017
P. 30
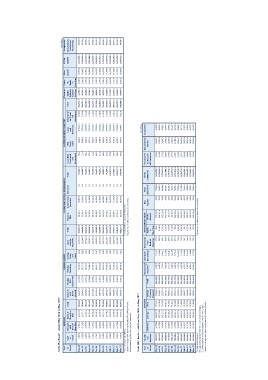
Table 19a: Banks* - Assets: May 2016 to May 2017
End RESERVES FOREIGN ASSETS CLAIMS ON CENTRAL GOVERNMENT CLAIMS ON PRIVATE SECTOR1 Claims on Claims Other TOTAL (Rs million)
of Assets2 ASSETS Acceptances
Period Cash Balances Bank of Total Balances Foreign Foreign Foreign Loans Total Treasury Government Advances Total Local Bills Bills Loans Investment Total Global on
in with Mauritius with Bills Securities Notes outside Bills Securities Purchased Recei- and in Shares Business 53,551.8 Documentary
May-16 80,182.4 Banks Mauritius vable Advances and Licence Banks 55,085.2 Credits and
Jun-16 Hand Bank of Bills 79,083.2 Discounted and and in 56,591.2 Guarantees
Jul-16 79,152.9 Abroad Discounted Debentures 52,690.3
Aug-16 Mauritius 78,142.6 Coins Holders Mauritius 55,947.8
Sep-16 79,624.9 569.2 60,032.8
Oct-16 4,397.0 52,531.2 23,254.2 76,826.9 323,980.4 23,183.3 60,708.2 464.8 245,616.8 653,953.5 28,126.1 58,957.0 0.0 87,083.0 515.4 3,806.1 274,117.9 3,238.2 281,731.4 44,553.8 3,042.2 59,364.1 1,204,098.2 61,593.8
Nov-16 80,676.4 0.0 91,885.8 382.7 59,415.2 1,208,024.6 60,789.9
Dec-16 4,325.5 49,186.1 25,571.7 85,930.5 310,434.3 26,215.6 58,712.9 382.9 252,640.8 648,386.4 31,944.5 59,941.4 0.0 93,467.6 370.4 3,845.5 275,419.6 3,970.6 283,751.1 46,223.1 3,609.8 55,464.2 1,232,072.6 59,891.6
Jan-17 90,885.0 257,782.9 663,123.6 30,530.5 62,937.0 0.0 94,067.0 212.0 56,676.2 1,217,889.8 61,767.7
Feb-17 4,259.3 49,956.5 24,937.1 88,107.4 315,638.0 22,721.5 66,518.1 463.1 253,561.1 658,343.9 31,636.3 62,430.6 0.0 96,766.6 402.8 3,519.8 278,353.3 4,212.8 286,468.6 48,485.6 4,783.3 60,758.3 1,220,424.0 60,580.2
Mar-17 84,273.2 252,765.8 646,706.9 33,556.4 63,210.2 0.0 99,012.4 411.5 55,725.7 1,222,511.5 62,443.5
Apr-17 4,587.5 50,244.5 23,310.6 89,326.8 310,745.4 22,204.8 71,439.2 393.4 253,033.5 644,986.5 34,122.1 64,890.3 0.0 98,231.2 383.3 3,572.5 276,487.6 4,139.1 284,569.6 47,380.5 2,695.9 56,895.0 1,257,613.4 65,750.4
May-17 93,347.2 256,178.3 682,895.8 32,266.3 65,964.9 0.0 98,882.8 365.0 1,240,729.8 63,362.1
4,731.4 51,653.4 23,240.1 307,560.0 20,383.1 65,556.4 441.5 259,176.2 656,008.6 30,855.9 68,026.8 0.0 96,884.8 374.6 3,914.7 277,460.7 4,123.1 285,710.4 50,480.2 5,187.3 1,249,770.5 63,130.6
0.0 102,077.9 326.4 1,245,549.1 60,281.5
4,726.7 48,853.1 23,247.1 304,060.4 25,731.2 61,641.7 519.7 0.0 107,860.0 386.2 3,955.6 279,155.0 4,021.3 287,534.6 48,858.5 5,259.8 1,282,562.9 61,374.5
0.0 108,337.6 453.5 1,273,400.2 60,761.4
5,012.7 52,424.9 23,238.8 339,974.9 25,307.2 60,964.8 470.6 0.0 106,709.0 3,956.8 273,512.2 4,949.4 282,829.9 49,029.8 4,586.3 1,284,522.0 64,488.7
6,186.1 56,633.0 23,111.4 301,579.9 34,624.0 60,022.1 606.3 4,063.9 275,885.6 5,150.9 285,483.7 49,579.8 5,429.3
5,517.2 60,821.5 24,546.3 299,002.4 29,263.7 64,645.2 572.2 269,123.4 662,606.8 30,438.1 66,446.7 3,791.9 274,549.0 5,573.6 284,279.5 53,283.8 6,366.4
265,258.0 652,769.9 33,601.4 68,476.5
5,086.0 57,043.1 25,978.4 296,457.9 21,812.6 68,802.7 438.7 262,370.9 674,377.7 36,683.1 71,176.9 3,875.9 275,253.7 5,574.3 285,078.5 57,175.7 3,663.5
264,143.7 671,581.3 40,961.9 67,375.7
5,412.9 53,617.7 25,242.6 309,384.2 24,677.8 77,530.6 414.3 263,206.6 681,510.0 38,336.8 68,372.3 4,762.9 276,040.7 5,581.2 286,711.2 61,457.1 7,125.4
4,918.7 61,745.6 22,662.5 312,720.4 20,697.4 73,672.7 347.2 4,806.7 274,926.7 6,071.1 286,190.6 59,446.1 2,792.0
4,518.4 63,856.6 24,972.2 333,673.7 15,431.1 68,766.5 432.1 4,670.0 274,894.1 6,371.3 286,388.9 56,875.9 2,796.1
1 For a breakdown, see Table 21 2Include Interbank Loans and Fixed Assets.
* Based on the segmental reporting of assets and liabilities of banks. Figures may not add up to totals due to rounding.
Source: Research and Economic Analysis Department.
Table 19b*: Banks - Liabilities: May 2016 to May 2017
End Capital DEPOSITS Government Interbank Borrowings BORROWINGS FROM Bills Other TOTAL Acceptances Documentary (Rs million)
of and Time Foreign Deposits 3 Borrowings from Payable Liabilities2 LIABILITIES on Account Credits Guarantees
Period Currency of Customers
Reserves Demand Savings1 Deposits Total Bank of Banks Banks
May-16 Mauritius in Abroad
Jun-16 136,282.1 52,794.6
Jul-16 132,159.2 54,762.1 979.9 Mauritius
Aug-16 137,883.7 56,380.9 869.1
Sep-16 136,819.6 55,714.2 200,207.9 77,072.7 532,409.1 862,484.3 5,588.9 2,010.7 864.7 384.7 120,036.8 441.6 75,889.2 1,204,098.2 2,499.9 15,132.4 43,961.6
Oct-16 137,213.7 56,593.3 879,212.4 5,643.3 2,536.4 858.6 358.8 76,358.5 1,208,024.6 3,123.1 15,812.8 41,854.0
Nov-16 136,142.5 57,725.5 205,734.6 75,080.1 543,635.7 895,957.3 5,574.4 5,064.1 866.0 1,245.6 109,641.4 443.6 68,868.8 1,232,072.6 3,273.9 14,987.6 41,630.1
Dec-16 136,018.1 57,020.1 903,263.5 4,369.3 5,108.3 860.4 399.6 64,000.1 1,217,889.8 2,587.5 17,685.2 41,494.9
Jan-17 135,951.8 59,423.8 207,615.3 76,023.3 555,937.8 909,753.9 4,717.7 5,948.1 837.2 1,856.0 115,559.9 432.0 68,091.3 1,220,424.0 2,530.9 18,098.1 39,951.2
Feb-17 142,949.7 60,661.5 903,902.1 4,449.2 8,015.9 754.0 469.8 72,507.3 1,222,511.5 2,507.2 17,514.4 42,421.9
Mar-17 142,838.5 60,612.7 208,082.8 74,901.2 564,565.3 929,357.4 4,689.3 6,791.9 757.6 1,633.4 101,437.3 568.1 75,211.5 1,257,613.4 2,594.7 21,453.9 41,701.9
Apr-17 140,450.1 60,772.1 907,814.7 4,752.0 10,005.2 747.7 356.5 73,560.6 1,240,729.8 2,596.5 20,110.7 40,655.0
May-17 141,446.5 61,419.6 210,429.4 74,270.2 568,461.0 913,028.3 4,899.6 7,010.0 748.5 1,659.6 91,741.7 446.5 67,786.9 1,249,770.5 2,501.7 20,854.0 39,774.9
141,080.2 62,152.4 916,173.0 4,979.7 6,129.6 756.2 697.8 71,344.3 1,245,549.1 2,810.1 19,873.8 37,597.6
210,584.3 73,321.1 562,271.2 936,192.8 7,669.1 8,551.5 770.5 1,528.5 94,635.7 639.4 78,688.0 1,282,562.9 1,943.1 18,110.2 41,321.2
923,493.4 8,690.4 4,668.4 548.1 74,636.1 1,273,400.2 1,539.3 18,412.4 40,809.7
211,451.2 73,684.6 587,201.5 939,647.8 10,688.3 5,717.6 980.4 103,159.5 331.1 76,067.4 1,284,522.0 1,392.1 22,644.0 40,452.5
218,787.6 72,368.3 557,235.0 1,685.9 105,849.1
218,874.7 71,855.9 561,636.2 1,923.9 110,967.9
220,863.6 73,339.0 561,357.7 635.7 102,002.7
221,806.3 72,972.5 580,642.0 1,576.4 108,047.1
222,655.1 70,862.2 568,556.5 805.1 118,355.9
222,425.3 71,808.6 583,261.4 727.0 109,492.2
1 Include margin deposits. Figures may not add up to totals due to rounding.
2 Include borrowings from other institutions (local and foreign).
3 Include budgetary and extra-budgetary units as from July 2013
* Based on the segmental reporting of assets and liabilities of banks.