
Page 31 - June 2017
P. 31
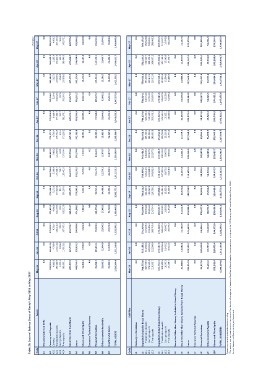
Table 20: Sectoral Balance Sheet of Banks*: May 2016 to May 2017
Code Assets May-16 Jun-16 Jul-16 Aug-16 Sep-16 Oct-16 Nov-16 Dec-16 Jan-17 Feb-17 Mar-17 Apr-17 (Rs million)
May-17
A1 Monetary Gold and SDRs 0.0 0.0 0.0 0.0 0.0 0.0 0.0 0.0 0.0 0.0 0.0 0.0
0.0
A2 Currency and Deposits 386,852.9 369,812.6 379,691.1 374,032.1 374,968.3 368,798.9 406,061.3 376,577.8 376,956.8 366,380.1 382,604.9 386,605.5
A2.1 Currency 4,861.8 4,708.4 4,722.4 4,980.9 5,172.9 5,246.4 5,483.2 6,792.4 6,089.4 5,524.6 5,827.1 5,265.9 408,934.3
A2.2 Transferable deposits 4,950.5
A2.3 Savings deposits 191,064.9 185,944.8 186,318.3 182,495.3 177,390.6 177,330.7 181,689.6 195,730.9 177,666.7 178,593.3 189,839.2 170,813.0
A2.4 Time deposits 1,031.2 1,026.4 882.9 938.1 854.7 790.7 934.1 816.4 822.7 897.9 1,069.4 926.1 207,147.2
963.5
A3 Securities other than Shares 189,895.1 178,133.1 187,767.5 185,617.8 191,550.1 185,431.0 217,954.4 173,238.2 192,378.1 181,364.2 185,869.2 209,600.6
195,873.1
A4 Loans 200,493.0 213,939.8 218,831.7 221,872.3 216,290.0 218,819.3 218,862.2 229,727.1 228,272.7 232,873.8 249,278.8 238,221.8
228,968.2
A5 Shares and Other Equity 560,934.5 570,910.3 580,688.6 574,209.7 578,903.9 582,193.5 579,170.8 581,392.8 591,594.9 592,291.7 595,538.8 594,650.9
592,684.1
A6 Insurance Technical Reserves 11,458.2 7,590.0 7,821.4 7,818.7 7,822.0 7,765.6 7,736.4 10,694.2 10,689.2 10,615.0 10,138.6 10,147.4
10,107.0
A7 Financial Derivatives 0.0 0.0 0.0 0.0 0.0 0.0 0.2 0.3 0.0 0.0 0.0 0.0
0.0
A8 Other Accounts Receivable 85,208.7 103,853.1 95,661.9 121,396.8 94,913.6 91,125.2 84,622.1 98,215.4 97,568.8 105,697.7 135,024.2 143,553.1
151,246.4
A9 Nonfinancial Assets 22,033.2 22,494.0 22,836.2 17,003.2 14,480.0 15,724.1 15,978.7 12,413.6 12,046.8 13,002.2 13,296.7 11,066.7
11,694.2
TOTAL ASSETS 22,413.5 22,570.0 22,671.4 22,728.6 25,395.2 26,786.5 26,871.7 26,869.6 26,494.1 26,515.1 26,656.0 26,446.3
26,461.8
1,289,394.0 1,311,169.8 1,328,202.2 1,339,061.3 1,312,772.9 1,311,213.1 1,339,303.4 1,335,890.7 1,343,623.3 1,347,375.6 1,412,538.1 1,410,691.7
1,430,095.9
Code Liabilities May-16 Jun-16 Jul-16 Aug-16 Sep-16 Oct-16 Nov-16 Dec-16 Jan-17 Feb-17 Mar-17 Apr-17 May-17
L1 Currency in Circulation 0.0 0.0 0.0 0.0 0.0 0.0 0.0 0.0 0.0 0.0 0.0 0.0 0.0
L2 Deposits Included in Broad Money 700,772.0 715,155.3 731,038.0 741,060.4 738,118.3 736,954.2 763,451.7 739,958.5 749,135.0 750,624.1 770,633.1 758,116.2 766,173.5
L2.1 Transferable deposits 307,756.5 311,866.0 337,865.3 339,389.8 341,319.3 341,112.5 343,047.2 335,746.1 343,648.2 347,744.6 355,200.4 351,910.7 358,823.0
L2.2 Savings deposits 176,621.8 180,899.2 183,409.3 184,966.2 186,062.8 186,808.8 187,427.3 194,558.5 195,933.5 197,842.5 198,613.2 199,308.3 198,882.4
L2.3 Time deposits 216,393.7 222,390.0 209,763.4 216,704.4 210,736.1 209,032.9 232,977.3 209,653.9 209,553.3 205,037.0 216,819.5 206,897.2 208,468.1
L3 Deposits Excluded from Broad Money 171,783.5 172,367.6 173,440.3 169,852.7 179,850.1 175,221.9 174,561.9 174,854.0 171,367.6 173,383.6 176,329.2 177,501.1 187,971.5
L3.1 Transferable deposits 108,382.5 108,296.4 106,417.3 102,198.1 109,294.5 107,201.5 108,150.2 110,760.0 109,964.5 105,617.6 104,935.3 104,163.4 113,267.7
L3.2 Savings deposits 16,241.3 16,455.2
L3.3 Time deposits 47,159.7 47,615.9 16,646.7 16,301.9 16,319.9 16,079.6 16,487.6 15,318.9 15,322.1 15,129.6 15,584.3 15,942.0 16,476.9
50,376.3 51,352.6 54,235.6 51,940.8 49,924.1 48,775.2 46,081.0 52,636.4 55,809.6 57,395.7 58,226.9
L4 Securities Other than Shares, Included in Broad Money 0.0 0.0 0.0 0.0 0.0 0.0 0.0 0.0 0.0 0.0 0.0 0.0 0.0
L5 Securities Other than Shares, Excluded from Broad Money 11,308.6 11,682.1 11,781.9 11,112.9 12,324.0 12,437.4 12,444.7 12,259.5 12,253.0 12,678.6 12,089.9 11,637.9 11,247.6
L6 Loans 134,314.8 123,523.7 131,633.5 118,899.4 108,768.9 113,615.3 120,446.3 127,260.2 129,572.3 118,344.5 127,648.9 133,267.2 125,373.6
L7 Insurance Technical Reserves 0.0 0.0 0.0 0.0 0.0 0.0 0.0 0.0 0.0 0.0 0.0 0.0 0.0
L8 Financial Derivatives 84,857.0 102,648.8 95,096.4 120,627.3 94,406.3 90,138.9 83,962.0 98,054.3 98,021.9 105,597.3 135,487.8 144,302.4 151,841.9
L9 Other Accounts Payable 54,115.6 56,759.9 54,640.0 48,874.9 49,662.8 52,371.1 52,419.2 51,000.9 48,924.4 51,326.3 56,333.1 50,652.0 51,341.3
L10 Shares and Other Equity 132,242.4 129,032.6 130,572.0 128,633.8 129,642.6 130,474.3 132,017.7 132,503.3 134,349.2 135,421.1 134,016.2 135,214.9 136,146.4
TOTAL LIABILITIES 1,289,394.0 1,311,169.8 1,328,202.2 1,339,061.3 1,312,772.9 1,311,213.1 1,339,303.4 1,335,890.7 1,343,623.3 1,347,375.6 1,412,538.1 1,410,691.7 1,430,095.9
Figures may not add up to totals due to rounding.
* The sectoral balance sheet contains the stock and flow data for all categories of assets and liabilities of banks, based on the concepts and principles of the IMF Monetary and Financial Statistics Manual (2000).
Source: Research and Economic Analysis Department.