
Page 47 - June 2017
P. 47
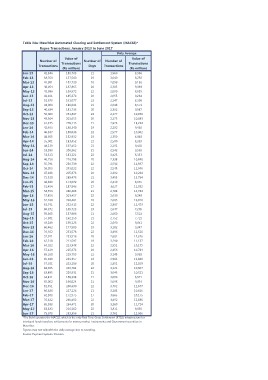
Table 34a: Mauritius Automated Clearing and Settlement System (MACSS)*

            Rupee Transactions: January 2013 to June 2017

                                                               Daily Average

             Number of       Value of       Number of           Number of       Value of
            Transactions  Transactions          Days           Transactions  Transactions
                          (Rs million)                                       (Rs million)

Jan-13      41,346                 188,703  21                 1,969         8,986

Feb-13      38,760                 157,540  19                 2,040         8,292

Mar-13      41,981                 182,730  20                 2,099         9,136

Apr-13      46,054                 187,865  20                 2,303         9,393

May-13      43,996                 189,972  22                 2,000         8,635

Jun-13      41,101                 185,678  20                 2,055         9,284

Jul-13      51,673                 191,077  23                 2,247         8,308

Aug-13      43,000                 180,041  21                 2,048         8,573

Sep-13      46,634                 181,738  20                 2,332         9,087

Oct-13      50,066                 251,847  23                 2,177         10,950

Nov-13      43,504                 201,655  20                 2,175         10,083

Dec-13      61,375                 278,115  21                 2,923         13,244

Jan-14      42,403                 180,340  19                 2,232         9,492

Feb-14      46,387                 180,036  18                 2,577         10,002

Mar-14      44,655                 152,932  19                 2,350         8,049

Apr-14      55,001                 183,452  22                 2,500         8,339

May-14      48,119                 197,452  21                 2,291         9,402

Jun-14      53,390                 200,862  21                 2,542         9,565

Jul-14      53,313                 183,321  22                 2,423         8,333

Aug-14      46,756                 216,798  20                 2,338         10,840

Sep-14      55,791                 250,739  22                 2,536         11,397

Oct-14      56,053                 243,022  22                 2,548         11,046

Nov-14      47,833                 205,673  20                 2,392         10,284

Dec-14      72,510                 289,473  21                 3,453         13,784

Jan-15      48,380                 173,092  20                 2,419         8,655

Feb-15      51,454                 187,546  17                 3,027         11,032

Mar-15      58,553                 268,463  21                 2,788         12,784

Apr-15      57,856                 203,457  22                 2,630         9,248

May-15      52,109                 206,401  20                 2,605         10,320

Jun-15      63,741                 252,415  22                 2,897         11,473

Jul-15      60,872                 165,725  23                 2,647         7,205

Aug-15      55,863                 157,986  21                 2,660         7,523

Sep-15      57,801                 162,159  21                 2,752         7,722

Oct-15      59,189                 199,123  22                 2,690         9,051

Nov-15      60,462                 177,585  19                 3,182         9,347

Dec-15      76,922                 253,578  22                 3,496         11,526

Jan-16      52,011                 253,516  20                 2,601         12,676

Feb-16      62,518                 211,597  19                 3,290         11,137

Mar-16      64,922                 223,848  22                 2,951         10,175

Apr-16      57,129                 215,673  20                 2,856         10,784

May-16      69,200                 219,755  22                 3,145         9,989

Jun-16      65,589                 261,357  22                 2,981         11,880

Jul-16      57,011                 222,186  20                 2,851         11,109

Aug-16      68,655                 226,764  22                 3,121         10,307

Sep-16      63,895                 220,931  21                 3,043         10,521

Oct-16      64,811                 188,398  21                 3,086         8,971

Nov-16      65,062                 196,024  21                 3,098         9,334

Dec-16      81,451                 260,639  22                 3,702         11,847

Jan-17      66,836                 227,128  21                 3,183         10,816

Feb-17      62,308                 172,975  17                 3,665         10,175

Mar-17      76,832                 260,402  22                 3,492         11,836

Apr-17      65,388                 234,471  20                 3,269         11,724

May-17      83,833                 216,262  22                 3,811         9,830

Jun-17      78,973                 253,396  21                 3,761         12,066

*The BoM operates the MACSS, which is the only Real Time Gross Settlement (RTGS) infrastructure for

interbank funds transfers, settlements for money market instruments and Government securities in

Mauritius.

Figures may not tally with the daily average due to rounding.

Source: Payment Systems Division.