
Page 51 - June 2017
P. 51
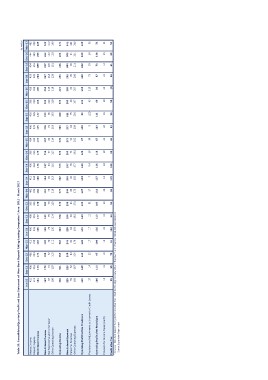
Table 39: Consolidated Quarterly Profit and Loss Statement of Non-Bank Deposit Taking Leasing Companies *:June 2012 - March 2017

                                                                                                                                                                                                                                                                                            (Rs million)

Interest Income                                        Jun-12    Sep-12    Dec-12    Mar-13     Jun-13    Sep-13                                         Dec-13    Mar-14     Jun-14    Sep-14    Dec-14    Mar-15     Jun-15    Sep-15    Dec-15    Mar-16     Jun-16    Sep-16   Dec-16   Mar-17
Interest Expense                                            422       408       408        415       400       408                                            399        405       412       400       398        414       406       402       396        418       433      434      444      462
Net Interest Income                                         241       235       234        228       235       231                                            229        223       224       224       219        241       231       225       230        229       229      235      235      233
                                                            181       173       174       187        165       177                                            170       182        188       176       179       173        175       177       166       189        204      199      209      229

Non-Interest Income                                    167 178 185 182 198 193 202 191 194 197 214 197 210 223 229 234 247 237 262 242
Net Fee Income and Commission                            67 71 72 70 78 79 79 73 81 81 97 83 91 90 110 115 118 106 112 112
Other Operating Income
                                                       100 107 113 112 120 114 123 118 113 116 117 114 119 133 119 119 129 131 150 130

Operating Income                                       348 351 359 369 363 370 372 373 382 373 393 370 385 400 395 423 451 436 471 471

Non-Interest Expense                                   225 223 240 243 220 246 239 246 248 247 265 273 277 311 263 289 291 304 305 341
Personnel Expenses                                       59 56 64 65 64 61 65 68 66 70 71 91 88 75 66 82 85 90 91 101
Other Operating Expenses
                                                       166 167 176 178 156 185 174 178 182 177 194 182 189 236 197 207 206 214 214 240

Operating Profit before Provisions                     123 128 119 126 143 124 133 127 134 126 128                                                                                                          97 108               89 132 134 160 132 166 130

Provision and Adjustments to Income for Credit Losses  17 14 22 17 17 12 31 17                                                                                                7 0.4 10 30                              5 (22) 63 115                            73 59 56 56

Operating Profit after Provisions                      106 114 97 109 126 112 102 110 127 126 118 67 103 111 69 20 87 73 110 74

Provision for Income Taxes/(credit)                    18 19 18 18 22 18 18 20 12 18 19 21 20 15 19 22 21 12 25 21

Profit after Tax                                       88 95 79 91 104 94 84 90 115 108 99 46 83 96 50                                                                                                                                               (2) 66 61 85 53

* Include all Non-Bank Deposit Taking Institutions other than Mauritius Housing Company Ltd and The Mauritius Civil Service Mutual Aid Association Ltd.

Source: Supervision Department