
Page 50 - June 2017
P. 50
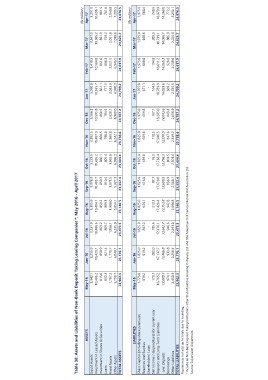
Table 38: Assets and Liabilities of Non-Bank Deposit Taking Leasing Companies *: May 2016 - April 2017

                             ASSETS                May-16        Jun-16        Jul-16       Aug-16       Sep-16       Oct-16                                      Nov-16       Dec-16       Jan-17        Feb-17        Mar-17        (Rs million)
Liquid Assets                                           3,342.1      3,255.9       3,231.9      3,305.9     3,378.3      3,221.5                                      3,382.5     3,566.3       3,580.8        3,418.2       3,347.0  Apr-17
Investment in Leased Assets
Investment in Shares & Securities                     10,406.2      10,420.1     10,486.6     10,404.1     10,405.7     10,455.2                                    10,487.0     10,595.8      10,555.7      10,564.8      10,585.2        3,291.0
Loans                                                     815.0         858.9        859.2        859.2        859.3        860.1                                       860.5        860.5         861.1         861.6         861.9      10,696.1
Fixed Assets                                              832.3         821.4        809.7        809.3        810.4        805.4                                       796.8        784.5         777.3         806.3         759.2
Other Assets                                                                                                                                                                                                                                  881.5
TOTAL ASSETS                                            1,767.2      1,770.7       1,850.1      1,908.0     1,971.5      1,965.8                                      1,969.8     2,020.1       2,033.9        2,021.5       2,051.8          761.6
                                                        5,799.7      6,049.1       6,235.9      5,854.1     5,927.3      6,096.3                                      6,242.1     6,960.0       6,990.3        6,945.5       7,018.6       2,040.8
                                                     22,962.5      23,176.1     23,473.5     23,140.5     23,352.4     23,404.4                                    23,738.6     24,787.2      24,799.2      24,617.9      24,623.7         7,205.5
                                                                                                                                                                                                                                         24,876.5
                    LIABILITIES                    May-16        Jun-16        Jul-16       Aug-16       Sep-16       Oct-16                                      Nov-16       Dec-16       Jan-17        Feb-17        Mar-17
                                                                                                                                                                      1,825.0      1,975.0      1,975.0        1,975.0       1,975.0  (Rs million)
Share Capital (including share premium)            1,775.0       1,825.0       1,825.0      1,825.0      1,825.0                                         1,825.0        659.8        659.8         671.1         668.6         668.6  Apr-17
                                                                                                                                                                           -            -            -              -             -
Reserves and Surplus                               819.2         819.2         847.2        634.1        616.0                                           659.8          110.5        167.1         164.5         194.8         209.3       1,975.0
                                                                                                                                                                                                                                              668.6
Shareholders' Loan                                 - - ----                                                                                                         17,946.5     18,285.0      18,783.9      18,611.2      18,739.1             -
                                                                                                                                                                                               14,093.8      14,063.3      14,080.7           248.6
Net income / (expenditure) for current year        170.7         202.0         185.6        213.3        87.7                                            76.3       13,970.0     14,043.6
                                                                                                                                                                        847.6        843.4         869.2         928.8         805.9      18,979.9
Deposits and Long-Term Liabilities                 16,765.2      17,137.7      17,376.1     17,428.4     17,678.8     17,738.4                                                                  2,335.5        2,239.6       2,225.8      14,268.0
                                                                                                                                                                      2,349.2      2,856.9    24,799.2      24,617.9      24,623.7
o/w: Deposits                                      13,080.3      13,466.8      13,642.7     13,753.8     13,699.9     13,796.3                                     23,738.6     24,787.2                                                      772.2
                                                                                                                                                                                                                                           2,232.1
Borrowings                                         974.1         933.8         946.6        942.8        836.9                                           803.5                                                                           24,876.5

Other Liabilities                                  2,458.3       2,258.4       2,293.0      2,096.8      2,308.1                                         2,301.4

TOTAL LIABILITIES                                  22,962.5      23,176.1      23,473.5     23,140.5     23,352.4     23,404.4

Figures may not add up to totals due to rounding.

* Include all Non-Bank Deposit Taking Institutions other than Mauritius Housing Company Ltd and The Mauritius Civil Service Mutual Aid Association Ltd.

Source: Supervision Department.