
Page 49 - June 2017
P. 49
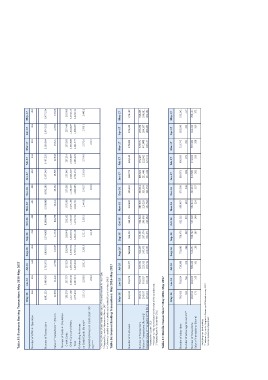
Table 35: Electronic Banking Transactions: May 2016-May 2017

Number of ATMs in Operation              May-16        Jun-16                 Jul-16       Aug-16        Sep-16        Oct-16        Nov-16        Dec-16        Jan-17        Feb-17        Mar-17        Apr-17        May-17
                                                  463           461                   463           461           458           455           454           456           453           453           452           453           453

Number of Transactions                   6,001,113 5,408,488 5,762,671 6,034,651 5,574,065 6,189,540 5,990,000 8,031,505 6,197,949 5,467,258 6,180,864 5,874,355 6,477,234

Value of Transactions * : (Rs mn)        12,894                      11,442   12,706       13,047        11,945        13,773        13,412        19,582        13,905        12,044        13,521        12,691        13,828

 Number of Cards in Circulation            258,179       257,767                257,823      258,048       258,048       258,162       257,569       257,866       257,845       257,514       257,969       257,460       259,008
  Credit Cards                           1,417,480     1,430,146              1,436,010    1,449,564     1,410,072     1,416,629     1,427,165     1,436,119     1,446,329     1,545,809     1,543,408     1,548,827     1,564,123
  Debit Cards and Others                 1,675,659     1,687,913              1,693,833    1,707,612     1,668,120     1,674,791     1,684,734     1,693,985     1,704,174     1,803,323     1,801,377     1,806,287     1,823,131
  Total
                                         2,314.1                     2,280.0  2,581.5      2,308.8       2,321.5       2,358.1       2,449.8       2,485.7       2,396.0       2,764.0       2,372.6       2,706.1       2,449.1
Outstanding Advances                                                   204.6                               214.0                                     193.3                                     201.5
on Credit Cards: (Rs mn)**

Impaired advances on credit cards : (Rs
mn) ***

* Involving the use of credit cards, debit cards, ATMs and Merchant Points of Sale.
** Restated figures for February and March 2017
*** Information available on a quarterly basis (restated figure for March 2016)

Table 36: Internet Banking Transactions: May 2016-May 2017

                                         May-16        Jun-16                 Jul-16       Aug-16        Sep-16        Oct-16        Nov-16        Dec-16        Jan-17        Feb-17        Mar-17        Apr-17        May-17

Number of Customers                      350,941       356,070                361,477      368,884       366,412       345,876       349,620       355,463       360,778       365,140       370,891       373,385       376,192

Number of Transactions                   601,131       582,876                626,682      584,459       573,380       604,324       607,626       830,011       605,621       569,487       670,574       266,338       318,235
                                                                              223,513      245,973       287,574       249,803       218,255       311,999       231,406       222,902       471,003       284,167       296,991
Value of Transactions: (Rs mn) β         234,637       369,827                225,756      228,283       234,871       236,364       234,718       241,158       231,406       227,153       308,437       302,369       301,294

Average Value of Transactions**/β (Rs m 197,391        226,130

Restated for October 2016

**Average monthly transactions from the start of the calendar year.

β Restated figure for September 2016

Table 37: Mobile Transactions*: May 2016-May 2017

                                         May-16        Jun-16                 Jul-16       Aug-16        Sep-16        Oct-16        Nov-16        Dec-16        Jan-17        Feb-17        Mar-17        Apr-17        May-17

Number of subscribers                    702,420       710,824                719,508      731,005       758,476       832,915       858,067       879,560       889,071       908,689       919,742       925,848       935,242

Number of active agents outlets**             581           564                    579          366           349           373           381           446           383           371           394           412           447

Number of transactions                   492,814       464,036                509,329      516,251       510,762       557,220       552,943       689,013       618,500       574,868       655,362       653,193       706,131
Value of transactions: (Rs mn)                171           165                    191          198           209           240           254           357           261           265           319           319           371

*including non bank entities
** restated figures for August to December 2016 and January 2017
Source: Supervision Department