
Page 55 - June 2017
P. 55
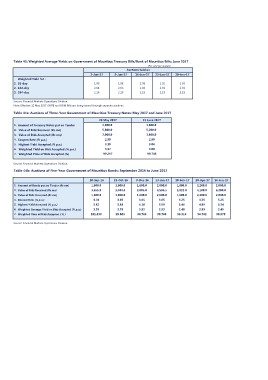
Table 43: Weighted Average Yields on Government of Mauritius Treasury Bills/Bank of Mauritius Bills: June 2017

                                                                                                                      (Per cent per annum)

                                                                                            Auctions held on

                                                     2-Jun-17   9-Jun-17                    16-Jun-17 23-Jun-17 30-Jun-17

Weighted Yield for :

1. 91-day                                            1.96 1.98 1.98 1.92 1.93

2. 182-day                                           2.04 2.03 2.03 2.01 2.01

3. 364-day                                           2.16 2.18 2.19 2.19 2.19

Source: Financial Markets Operations Division.
Note: Effective 12 May 2017 GMTB and BOM Bills are being issued through separate auctions.

Table 44a: Auctions of Three-Year Government of Mauritius Treasury Notes: May 2017 and June 2017

1. Amount of Treasury Notes put on Tender            26 May 2017                            23 June 2017
2. Value of Bids Received (Rs mn)                       2,000.0                                1,800.0
3. Value of Bids Accepted (Rs mn)                       5,800.0                                5,200.0
4. Coupon Rate (% p.a.)                                 2,000.0                                1,800.0
5. Highest Yield Accepted (% p.a.)                         2.90                                   2.90
6. Weighted Yield on Bids Accepted (% p.a.)                3.19                                   3.06
7. Weighted Price of Bids Accepted (%)                     3.17                                   3.00
                                                         99.297                                 99.745

Source: Financial Markets Operations Division.

Table 44b: Auctions of Five-Year Government of Mauritius Bonds: September 2016 to June 2017

1. Amount of Bonds put on Tender (Rs mn)             20-Sep-16  21-Oct-16                   9-Dec-16  13-Jan-17                             10-Feb-17  20-Apr-17  16-Jun-17
2. Value of Bids Received (Rs mn)                     1,800.0    1,600.0                    1,600.0    2,000.0                               1,800.0    2,200.0    2,000.0
3. Value of Bids Accepted (Rs mn)                     3,655.9    3,404.4                    2,005.0    4,596.5                               3,832.0    4,100.0    6,200.0
4. Interest Rate (% p.a.)                             1,800.0    1,600.0                    1,600.0    2,000.0                               1,800.0    2,200.0    2,000.0
5. Highest Yield Accepted (% p.a.)                      4.10                                                                                   3.25       3.25
6. Weighted Average Yield on Bids Accepted (% p.a.)     3.82       3.65                       3.65       3.65                                  3.44       4.09       3.25
7. Weighted Price of Bids Accepted ( % )                3.76       3.88                       4.10       3.99                                  3.40       3.99       3.54
                                                      101.439      3.76                       3.93       3.93                                99.316      96.782      3.49
Source: Financial Markets Operations Division.                   99.503                      98.768    98.768                                                      98.975