
Page 60 - June 2017
P. 60
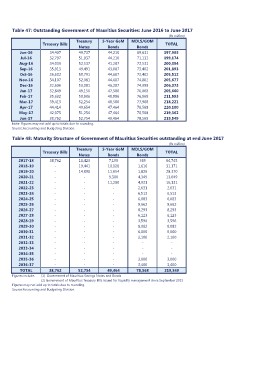
Table 47: Outstanding Government of Mauritius Securities: June 2016 to June 2017

                                                                              (Rs million)

         Treasury Bills                    Treasury      5-Year GoM MDLS/GOM  TOTAL
                                            Notes
                                                         Bonds        Bonds

Jun-16   34,407                            49,737        44,210       69,631  197,985

Jul-16   32,797                            51,037        44,210       71,131  199,174

Aug-16   34,039                            52,537        41,287       72,531  200,394

Sep-16   35,913                            49,491        43,087       73,402  201,893

Oct-16   36,632                            50,791        44,687       73,402  205,512

Nov-16   34,107                            52,081        44,687       74,802  205,677

Dec-16   32,606                            53,381        46,287       74,099  206,373

Jan-17   32,849                            49,156        47,586       76,068  205,660

Feb-17   35,632                            50,906        48,986       76,068  211,593

Mar-17   39,413                            52,254        48,586       77,968  218,221

Apr-17   44,414                            49,654        47,464       78,568  220,100

May-17   42,075                            51,254        47,464       78,568  219,362

Jun-17   38,762                            52,754        49,464       78,568  219,549

Note: Figures may not add up to totals due to rounding.

Source:Accounting and Budgeting Division.

Table 48: Maturity Structure of Government of Mauritius Securities outstanding at end June 2017

                                                                              (Rs million)

         Treasury Bills                    Treasury      5-Year GoM MDLS/GOM  TOTAL
                                            Notes
                                                         Bonds        Bonds

2017-18  38,762                            18,423        7,190        369 64,745

2018-19  -                                 19,441        10,120       1,610   31,171

2019-20  -                                 14,890        11,654       1,826   28,370

2020-21  -                                 -             9,300        4,349   13,649

2021-22  -                                 -             11,200       4,931   16,131

2022-23  -                                 -             -            2,631   2,631

2023-24  -                                 -             -            6,513   6,513

2024-25  -                                 -             -            6,083   6,083

2025-26  -                                 -             -            9,662   9,662

2026-27  -                                 -             -            8,293   8,293

2027-28  -                                 -             -            6,123   6,123

2028-29  -                                 -             -            3,596   3,596

2029-30  -                                 -             -            8,082   8,082

2030-31  -                                 -             -            6,000   6,000

2031-32  -                                 -             -            2,100   2,100

2032-33  -                                 -             -            -       -

2033-34  -                                 -             -            -       -

2034-35  -                                 -             -            -       -

2035-36  -                                 -             -            3,000   3,000

2036-37  -                                 -             -            3,400   3,400

TOTAL    38,762                            52,754        49,464       78,568  219,549

Figures include: (1) Government of Mauritius Savings Notes and Bonds

                          (2) Government of Mauritius Treasury Bills issued for liquidity management since September 2015
Figures may not add up to totals due to rounding.
Source:Accounting and Budgeting Division.