
Page 76 - June 2017
P. 76
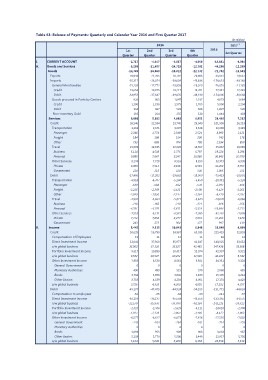
Table 63: Balance of Payments: Quarterly and Calendar Year 2016 and First Quarter 2017
2016 (Rs million)
1st 2nd 3rd 4th 2016 2017 1
Quarter Quarter Quarter Quarter
1st Quarter
-2,717 -4,660
I. CURRENT ACCOUNT -5,289 -4,647 -6,857 -12,781 -18,881 -4,984
A. Goods and Services -14,369 -11,487 -14,729 -22,732 -44,286 -12,269
20,948 -16,869 -18,812 -72,782 -19,501
Goods -35,317 20,906
Exports -15,295 21,205 20,792 -43,638 83,851 19,687
Imports 19,658 -38,074 -39,604 -23,929 -156,633 -39,188
General Merchandise -34,953 -17,772 -19,859 19,201 -21,185
Credit 19,875 19,217 -43,130 -76,855 17,483
Debit 926 -37,647 -39,076 77,951 -38,668
Goods procured in Ports by Carriers 1,290 1,197 -154,806
Credit -364 903 1,047 1,705 1,684
Debit -195 1,330 1,575 -508 4,073 2,204
Non-monetary Gold 9,080 -427 -528 -330 5,900 -520
26,540 -264 -255 9,951 -1,827 -403
Services 3,263 5,382 4,083 29,040 -1,044 7,232
Credit 2,346 22,584 23,745 3,528 28,496 26,233
Transportation 2,671 3,207 2,524 101,909 3,149
Passenger 184 1,774 2,349 12,669 2,121
Freight 733 206 8,993
Other 15,003 198 154 798 178
Travel 5,114 699 704 16,657 742 850
Business 9,889 12,185 12,022 5,797 2,934 16,086
Personal 8,274 4,538 3,775 10,860 55,867 5,296
Other Services 8,060 7,647 8,247 8,855 19,224 10,790
Private 214 7,728 8,516 8,519 36,643 6,998
Government -17,460 7,513 8,196 336 33,373 6,767
Debit -4,914 215 320 -19,089 32,288 231
Transportation -639 -17,202 -19,662 -5,450 1,085 -19,001
Passenger -2,226 -4,707 -5,260 -578 -73,413 -5,124
Freight -2,049 -588 -592 -2,508 -20,331 -566
Other -4,991 -2,269 -2,521 -2,364 -2,397 -2,261
Travel -210 -1,850 -2,147 -5,644 -9,524 -2,297
Business -4,781 -4,364 -5,821 -321 -8,410 -6,068
Personal -7,555 -185 -210 -5,323 -20,820 -356
Other Services -7,312 -4,179 -5,611 -7,995 -926 -5,712
Private -243 -8,131 -8,581 -7,818 -19,894 -7,809
Government 5,442 -7,858 -8,277 -177 -32,262 -7,670
50,629 -273 -304 8,848 -31,265 -139
B. Income 9,315 10,043 63,033 -997 8,869
Credit 12 56,790 54,967 33,648 52,893
Compensation of Employees 33,041 11 225,419
Direct Investment Income 33,002 11 12 41,647 12
o/w global business 37,360 35,977 41,481 46 33,632
Portfolio Investment Income 9,617 37,326 35,627 12,074 148,025 33,568
o/w global business 9,552 10,889 10,417 11,901 147,436
Other Investment Income 7,959 10,547 10,222 9,921
General Government 9,301 42,997 9,742
Monetary Authorities 0 8,530 8,561 0 42,222 9,328
Banks 490 0 0 34,351
Other Sectors 3,734 570 0
o/w global business 3,735 493 515 3,830 0 685
Debit 3,726 3,698 3,843 4,901 2,068 4,214
Compensation to employees -45,187 4,339 4,203 4,891 15,105 4,429
Direct Investment Income -52 4,335 4,200 -54,185 17,178 4,357
o/w global business -36,134 -47,475 -44,924 17,152 -44,024
Portfolio Investment Income -32,579 -60 -191,771 -57
o/w global business -2,424 -65 -64 -43,556 -241 -34,575
Other Investment Income -1,927 -38,137 -35,558 -40,164 -153,385 -34,422
General Government -6,577 -35,976 -34,496 -143,215 -2,390
Monetary Authorities -245 -3,111 -10,610 -1,903
Banks -2,446 -2,629 -2,403 -8,522 -7,002
Other Sectors 0 -2,128 -2,064 -7,458 -27,535 -259
o/w global business -1,094 -6,827 -6,673 -714
-5,238 -101 0
-5,104 -104 -264 0 0 -987
0 0 -3,864 -5,756
-908 -22,957 -5,519
-953 -909 -6,449 -22,558
-5,770 -5,500 -6,358
-5,636 -5,460