
Page 73 - June 2017
P. 73
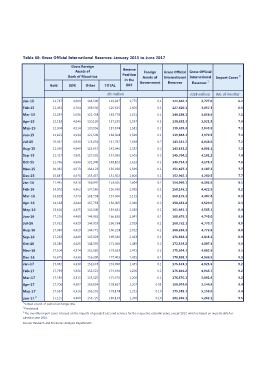
Table 60: Gross Official International Reserves: January 2015 to June 2017

                               Gross Foreign                 Reserve        Foreign   Gross Official  Gross Official  Import Cover 3
                                   Assets of                 Position      Assets of  International   International
                                                                         Government
                             Bank of Mauritius                in the                     Reserves       Reserves 1
                                                                IMF
                     Gold    SDR          Other     TOTAL

                                                    (Rs million)                                      (US$ million) (No. of months)

Jan-15               11,787  4,600 103,500          119,887       1,775  0.1 121,662.1                3,727.0                                                         6.2

Feb-15               11,461  4,704 109,650          125,815       1,805  0.1 127,620.1                3,837.3                                                         6.5

Mar-15               12,284  5,036 121,458          138,778       1,611  0.1 140,389.1                3,856.5                                                         7.1

Apr-15               12,183  4,946 120,126          137,255       1,597  0.3 138,852.3                3,921.8                                                         7.0

May-15               12,004  4,914 120,956          137,874       1,581  0.2 139,455.2                3,943.5                                                         7.1

Jun-15               11,821  4,934 121,549          138,304       1,590  0.1 139,894.1                3,979.5                                                         7.3

Jul-15               10,952  4,936 125,854          141,742       1,589  0.2 143,331.2                4,048.6                                                         7.2

Aug-15               11,360  4,949 125,637          141,946       1,587  0.2 143,533.2                4,085.1                                                         7.3

Sep-15               11,417  4,991 127,691          144,099       1,605  0.2 145,704.2                4,101.2                                                         7.4

Oct-15               11,766  4,996 131,340          148,102       1,612  0.1 149,714.1                4,175.3                                                         7.6

Nov-15               10,932  4,973 134,123          150,028       1,599  0.1 151,627.1                4,187.3                                                         7.7

Dec-15               10,887  4,978 135,437          151,302       1,600  0.1 152,902.1                4,260.5                                                         7.7

Jan-16               11,445  4,978 136,942          153,365       1,604  0.1 154,969.1                4,303.6                                                         8.1

Feb-16               14,002  4,462 137,586          156,050       2,095  0.1 158,145.1                4,422.6                                                         8.2

Mar-16               13,829  4,473 138,758          157,060       2,115  0.1 159,175.1                4,497.8                                                         8.3

Apr-16               14,168  4,444 137,793          156,405       2,046  0.2 158,451.2                4,529.0                                                         8.3

May-16               13,626  4,475 141,540          159,641       2,050  0.1 161,691.1                4,565.1                                                         8.4

Jun-16               17,216  4,460 144,962          166,638       2,041  0.1 168,679.1                4,745.0                                                         8.8

Jul-16               17,352  4,429 144,953          166,734       2,018  0.1 168,752.1                4,770.7                                                         8.8

Aug-16               17,030  4,423 144,771          166,224       2,012  0.1 168,236.1                4,772.6                                                         8.8

Sep-16               17,263  4,449 147,828          169,540       2,023  0.1 171,563.1                4,845.1                                                         8.9

Oct-16               18,280  4,425 148,355          171,060       1,489  0.2 172,549.2                4,807.4                                                         9.0

Nov-16               17,104  4,374 152,085          173,563       1,471  0.1 175,034.1                4,862.6                                                         9.1

Dec-16               16,675  4,338 156,390          177,403       1,455  0.1 178,858.1                4,966.9                                                         9.3

Jan-17               17,082  4,338 152,678          174,098       1,455  0.1 175,553.1                4,925.5                                                         9.2

Feb-17               17,793  4,326 152,521          174,640       1,206  0.2 175,846.2                4,943.7                                                         9.2

Mar-17               17,530  4,315 153,525          175,370       1,200  0.1 176,570.1                5,001.9                                                         9.2

Apr-17               17,706  4,307 156,854          178,867       1,207  0.03 180,074.0               5,144.9                                                         9.4

May-17               17,567  4,316 156,291          178,174       1,211  0.10 179,385.1               5,158.0                                                         9.4
                                                                                                                                                                      9.5
Jun-17 2             17,125  4,309 158,725          180,159       1,206  0.10 181,365.1               5,262.1

1 Valued at end-of-period exchange rate.

2 Provisional

3 The monthly import cover is based on the imports of goods (f.o.b.) and services for the respective calendar years, except 2017, which is based on imports data for

calendar year 2016.

Source: Research and Economic Analysis Department.