Page 72 - June 2017
P. 72

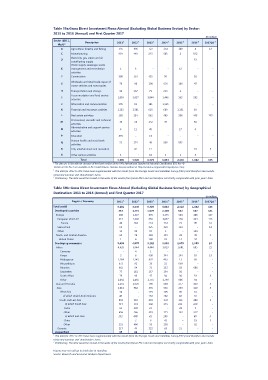
Table 59a:Gross Direct Investment Flows Abroad (Excluding Global Business Sector) by Sector:
2011 to 2016 (Annual) and First Quarter 2017

Sector (ISIC 1              Description             2011 1   2012 1    2013 1    2014 1    2015 2                                               2016 2     (Rs million)
    digit)*                                           535      696       527       254       108                                                   4      2017Q1 2
                                                     991       449       213       503        2
A Agriculture, forestry and fishing                       -         -         -         -         -                                               812          13
                                                                                                                                                  53               -
C Manufacturing                                        1        6             -         -    12                                                                    -
                                                                                                                                                       -
D Electricity, gas, steam and air                    308       114       425       98             -                                                                -
            conditioning supply                                                                                                                   38
            Water supply; sewerage, waste                                                                                                                          -

E management and remediation
            activities

F Construction

G Wholesale and retail trade; repair of 78                   90 108 656 106 47                                                                                -
            motor vehicles and motorcycles

H Transportation and storage                         34       167       71        233       2                                                       -         -
I Accommodation and food service                    1,850    1,017     3,044     1,446     162                                                  282           -
                                                     195                181      1,165                                                                        -
            activities                                        19                               -                                                    -
J Information and communication

K Financial and insurance activities                1,252    2,381     618       609 1,131                                                      69            -

L Real estate activities                            165 254 862 409 286 448 139

M Professional, scientific and technical            34       28 152 39                         - 58                                                           -
            activities                              8                                                                                                         -
                                                             11 45                    - 17                                                      8
N Administrative and support service
            activities

P Education                                         575 - 13                          --                                                            --

Q Human health and social work                      72 274 40 599 583                                                                               --
            activities

R Arts, entertainment and recreation                    - 42           12             -        - 18                                                       3

S Other service activities                          3           - 18             2         1                                                    5             -

                     Total                          6,101    5,549     6,329     6,013     2,410                                                1,842     155

* The data are in line with the structure of the fourth revision of the UN's International Standard of Industrial Classification (ISIC Rev. 4)

Details on ISIC Rev.4 are available on the United Nations Statistics Division website at http://unstats.un.org/unsd/cr/registry/isic-4.asp

1 The data for 2011 to 2014 have been supplemented with the results from the Foreign Assets and Liabilities Survey (FALS) and therefore also include

reinvested earnings and shareholders’ loans.
2 Preliminary. The data would be revised in the wake of the results from future FALS and are therefore not strictly comparable with prior years' data.

Table 59b: Gross Direct Investment Flows Abroad (Excluding Global Business Sector) by Geographical

Destination: 2011 to 2016 (Annual) and First Quarter 2017

                                                                                                                                                          (Rs million)

                Region / Economy                    2011 1   2012 1    2013 1    2014 1    2015 2                                               2016 2    2017Q1 2

Total world                                         6,101    5,549     6,329     6,013     2,410                                                1,842     155

Developed countries                                 357      1,397     1,079     2,359     532                                                  537       131

Europe                                              288 1,327 876 2,175 504 488 127

European Union 27                                   214 1,228 656 2,047 170 324 113

France                                              44 184 214 714 73 151 33

Switzerland                                         61 - 125 128 334                                                                                - 14

Other                                               13 99 95                     1             - 164                                                           -

North and Central America                           69 70 203 184 28 49                                                                                   4

United States                                       1 6 108 83 14 44                                                                                          -

Developing economies                                5,659    4,070     5,242     3,653     1,878                                                1,305     24

Africa                                              4,428    3,044     4,444     3,023     1,601                                                895       21

Comoros                                                  -4            1            - ---

Kenya                                               2        6         498 344 144                                                              53        13

Madagascar                                          1,184    1,145     897       483       13                                                   68            -

Mozambique                                          672 92 16 32 660                                                                                --

Reunion                                             382 54             72 132 38 686                                                                          -

Seychelles                                          77 181 157 184 30                                                                               --

South Africa                                        79 96 47 50 30 54                                                                                     8

Other                                               2,032    1,466     2,756     1,798     686                                                  34            -

Asia and Oceania                                    1,231    1,026     798       630       277                                                  410       3

Asia                                                1,014    982       576       565       256                                                  410       3

West Asia                                           46            - 175          195       95                                                   10            -

        of which United Arab Emirates               46            - 174          194       68                                                   10            -

South and East Asia                                 968 982 401 370 161 400                                                                               3

        of which South Asia                         717 574 360 171 161 320                                                                                   -

        India                                       61 308 21                         - 28                                                      3             -

        Other                                       656 266 339 171 133 317                                                                                   -

        of which East Asia                          251 408 41 199                             - 80                                                       3

        China                                                2 6 41                            - 18                                                       3

        Other                                       251 406 35 158                             - 62                                                           -

Oceania                                             217 44 222 65                          21                                                       --

Unspecified                                         85 82              8         1             ---

1 The data for 2011 to 2014 have been supplemented with the results from the Foreign Assets and Liabilities Survey (FALS) and therefore also include

reinvested earnings and shareholders’ loans.
2 Preliminary. The data would be revised in the wake of the results from future FALS and are therefore not strictly comparable with prior years' data.

Figures may not add up to totals due to rounding.
Source: Research and Economic Analysis Department.
   67   68   69   70   71   72   73   74   75   76   77