Page 74 - June 2017
P. 74

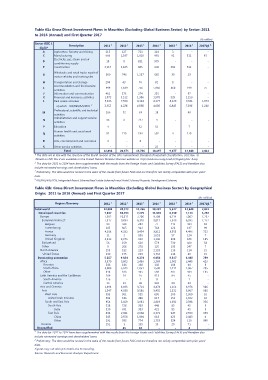
Table 61a Gross Direct Investment Flows in Mauritius (Excluding Global Business Sector) by Sector: 2011

to 2016 (Annual) and First Quarter 2017

                                                                                                                                                 (Rs million)

Sector (ISIC 1              Description                 2011 1  2012 1   2013 1  2014 1  2015 2                  2016 2                          2017Q1 2
    digit)*
                                                         215     127      723     114       3                          -                                 -
       A Agriculture, forestry and fishing               669    1,597    1,020    991      91                     511                                93
                                                          18              831     979
       C Manufacturing                                  2,117      8      865     602          -                       -                                 -
                   Electricity, gas, steam and air              2,305                     332                     511                                    -

       D
                   conditioning supply

       F Construction

                   Wholesale and retail trade; repair of        746 1,237 685            30                      23                                  -
       G 600

                   motor vehicles and motorcycles

       H Transportation and storage                     204 43 76 82                     8                           --

       I Accommodation and food service 999 1,839 756 5,986 860                                                  199                             75
                  activities

       J Information and communication 462 373 274 235                                       - 97                                                    -

       K Financial and insurance activities             1,972   5,512    1,386   1,978   229                     2,150                               -

       L Real estate activities                         5,236   7,553    6,124   6,177   8,120                   9,931                           1,873

                of which - IRS/RES/IHS/PDS 3            3,352   4,228    4,598   4,038   6,842                   7,936                           1,240

       M        Professional, scientific and technical  266     52       33      18          - 40                                                     -
                                                                                             --                                                       -
                activities

       N Administrative and support service             38      8 217 4
                   activities

       P Education                                      4           - 32         32          -7                                                       -

       Q Human health and social work                   91 210 184 592 4 179                                                                          -
                   activities

       R Arts, entertainment and recreation             3           -8               --- -

       S Other service activities                           - - - 22                         -- -

                       Total                            12,894  20,373   13,766  18,497  9,677                   13,648                          2,041

* The data are in line with the structure of the fourth revision of the UN's International Standard of Industrial Classification (ISIC Rev. 4).

Details on ISIC Rev.4 are available on the United Nations Statistics Division website at http://unstats.un.org/unsd/cr/registry/isic-4.asp

1 The data for 2011 to 2014 have been supplemented with the results from the Foreign Assets and Liabilities Survey (FALS) and therefore also

include reinvested earnings and shareholders’ loans.
2 Preliminary. The data would be revised in the wake of the results from future FALS and are therefore not strictly comparable with prior years'

data.
3 IRS/RES/IHS/PDS: Integrated Resort Scheme/Real Estate Scheme/Invest Hotel Scheme/Property Development Scheme.

Table 61b: Gross Direct Investment Flows in Mauritius (Excluding Global Business Sector) by Geographical

Origin: 2011 to 2016 (Annual) and First Quarter 2017

                                                                                                                                                                                  (Rs million)

                Region /Economy                         2011 1  2012 1   2013 1  2014 1  2015 2                  2016 2 2017Q1 2

Total world                                             12,894  20,373   13,766  18,497  9,677                   13,648                          2,041

Developed countries                                     7,637   10,493   7,429   11,841  6,330                   7,176                           1,252
 Europe                                                 7,382   10,311   7,206    9,709  6,214                   7,062                           1,237
   European Union 27                                    7,317    9,884   6,318    9,011  5,349                   6,395                           1,172

     Belgium                                             93      598      204     77      112                     434                            83
     Luxembourg                                          185     365      322     764     126                     137                            99
     France                                             4,018   4,282    3,434   3,811   3,555                   4,496                           722
     Germany                                             11               856    1,053    57                      124                             7
     United Kingdom                                     2,312     2       620    1,106    908                     633                            185
 Switzerland                                             56     4,076     610     573     730                     420                            58
 Other                                                           159      278     125     135                     247                             7
North America                                             9      268      223    2,132    116                     114                            15
  United States                                          255     182      219    1,732    114                     69                             15
                                                         230     175

Developing economies                                    5,257   9,854    6,274   6,656   3,347                   6,468                           789
  Africa                                                3,570   5,802    2,456   2,269   2,002                   2,445                           423
      Reunion                                            246     146      168     141     104
      South Africa                                      3,006   5,343    1,851   1,530   1,411                     44                             3
      Other                                              318     313      435     598     487                    1,967                           285
  Latin America and the Caribbean                        189                      913                             434                            135
      South America                                      176      19       97              84
      Central America                                                 -     1      12          -                   45                                -
  Asia and Oceania                                        13               96     901                               1                                -
    Asia                                                1,498     19     3,721   3,474     84                      44                                -
       West Asia                                        1,347   4,033    3,586   3,455   1,261                   3,978                           366
           United Arab Emirates                          393    4,030     555     636    1,232                   3,907                           366
       South and East Asia                               393     361      488     617     200                    1,309                           10
           South Asia                                    954     336     3,031   2,819    152                    1,022                           10
                                                         518    3,669     363     448    1,032                   2,598                           356
                                                                 728                                               45                             3
                                                                                           85

                India                                   510 691 353 421                  85                      45                              3
          East Asia
                                                        436     2,941    2,668   2,371   947                     2,553                           353

                China                                   245     2,558    1,894   618     423 2,443                                               4

                Other                                   191 383 774 1,753 524 110 349

       Oceania                                          151 3 135 19 29 71                                                                            -

Unspecified                                                 - 26         63          - -4                                                            -

1 The data for 2011 to 2014 have been supplemented with the results from the Foreign Assets and Liabilities Survey (FALS) and therefore also

include reinvested earnings and shareholders’ loans.

2 Preliminary. The data would be revised in the wake of the results from future FALS and are therefore not strictly comparable with prior years'

data.

Figures may not add up to totals due to rounding.

Source: Research and Economic Analysis Department.
   69   70   71   72   73   74   75   76   77   78   79