Page 15 - May 2017
P. 15

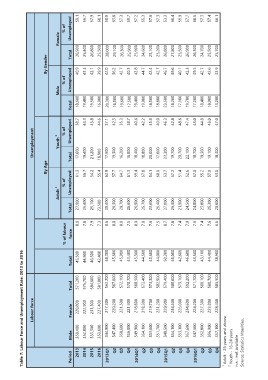
Table 7: Labour Force and Unemployment Rate: 2013 to 2016                                        Unemployment
                                 Labour force

                                                                                By Age                                            By Gender

Period  Male     Female                 Total     Total    % of labour           Adult 1                  Youth 2         Total   Male          Total  Female
                                        571,200                force                       % of                     % of                  % of                  % of
                                        575,700
                                        584,600                         Total Unemployed         Total Unemployed                   Unemployed            Unemployed
                                        581,000
2013 350,400                   220,800   562,200  45,500   8.0          27,900  61.3             17,600        38.7       18,600  40.9          26,900  59.1
                                         567,600
2014 352,800                   222,900   572,100  44,800   7.8          25,400  56.7             19,400        43.3       19,400  43.3          25,400  56.7
                                         578,700
2015 353,300                   231,300   568,500  46,300   7.9          25,100  54.2             21,200        45.8       19,500  42.1          26,800  57.9
                                         572,400
2016 353,600                   227,400   573,300  42,400   7.3          23,500  55.4             18,900        44.6       16,900  39.9          25,500  60.1
                                         582,900
2013Q1  344,900                217,300   579,400  48,300   8.6          30,400  62.9             17,900        37.1       20,300  42.0          28,000  58.0
                                         588,600
Q2 347,400 220,200                       579,100  45,600   8.0          26,300  57.7             19,300        42.3       16,500  36.2          29,100  63.8
                                         592,200
Q3 350,600 221,500                       571,700  45,900   8.0          29,700  64.7             16,200        35.3       19,600  42.7          26,300  57.3
                                         580,100
Q4 356,800 221,900                       580,700  43,400   7.5          26,600  61.3             16,800        38.7       17,500  40.3          25,900  59.7
                                         585,500
2014Q1  349,900                218,600            45,300   8.0          26,900  59.4             18,400        40.6       19,400  42.8          25,900  57.2

Q2 354,100 218,300                                44,500   7.8          25,700  57.8             18,800        42.2       19,900  44.7          24,600  55.3

Q3 353,600 219,700                                43,600   7.6          23,600  54.1             20,000        45.9       18,500  42.4          25,100  57.6

Q4 351,700 231,200                                44,000   7.5          26,400  60.0             17,600        40.0       18,800  42.7          25,200  57.3

2015Q1  349,500                229,900            50,300   8.7          27,000  53.7             23,300        46.3       23,500  46.7          26,800  53.3

Q2 354,100 234,500                                46,000   7.8          26,300  57.2             19,700        42.8       18,200  39.6          27,800  60.4

Q3 353,100 226,000                                42,600   7.4          21,900  51.4             20,700        48.6       17,100  40.1          25,500  59.9

Q4 357,600 234,600                                46,600   7.9          24,500  52.6             22,100        47.4       19,700  42.3          26,900  57.7

2016Q1  347,500                224,200            43,500   7.6          24,800  57.0             18,700        43.0       17,200  39.5          26,300  60.5

Q2 352,800 227,300                                43,100   7.4          23,800  55.2             19,300        44.8       18,400  42.7          24,700  57.3

Q3 356,900 223,800                                44,400   7.6          25,300  57.0             19,100        43.0       18,900  42.6          25,500  57.4

Q4 357,100 228,400                                38,900   6.6          20,600  53.0             18,300        47.0       13,200  33.9          25,700  66.1

1 Adult - 25 years and above
2 Youth - 16-24 years
n.a. : not available
Source: Statistics Mauritius.
   10   11   12   13   14   15   16   17   18   19   20