
Page 18 - May 2017
P. 18
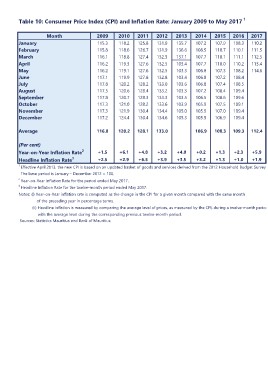
Table 10: Consumer Price Index (CPI) and Inflation Rate: January 2009 to May 2017 1

                 Month        2009                    2010   2011      2012   2013      2014   2015   2016                  2017
January                       115.3                   118.2  125.8     131.9  135.7     107.2  107.9  108.3                 110.2
February                      115.8                   118.6  126.7     131.9  136.6     108.5  110.7  110.1                 111.5
March                         116.1                   118.8  127.4     132.3  137.1     107.7  110.1  111.1                 112.5
April                         116.2                   119.3  127.6     132.5  103.4     107.7  110.0  110.2                 113.4
May                           116.2                   119.1  127.6     132.5  103.3     106.8  107.3  108.2                 114.6
June                          117.1                   119.9  127.8     132.8  103.4     106.8  107.2  108.4
July                          117.8                   120.2  128.2     133.0  103.6     106.8  107.4  108.5
August                        117.5                   120.6  128.4     133.2  103.3     107.2  108.4  109.4
September                     117.8                   120.7  128.3     133.3  103.5     106.5  108.6  109.6
October                       117.3                   121.0  128.2     133.6  103.9     105.9  107.5  109.1
November                      117.3                   121.9  130.4     134.4  105.0     105.9  107.0  109.4
December                      117.2                   124.4  130.4     134.6  105.3     105.5  106.9  109.4

Average                       116.8 120.2 128.1 133.0                                   106.9 108.3 109.3 112.4

(Per cent)

Year-on-Year Inflation Rate2  +1.5                    +6.1 +4.8 +3.2 +4.0 +0.2 +1.3 +2.3 +5.9

Headline Inflation Rate3      +2.5                    +2.9 +6.5 +3.9 +3.5 +3.2 +1.3 +1.0 +1.9

1 Effective April 2013, the new CPI is based on an updated basket of goods and services derived from the 2012 Household Budget Survey.

 The base period is January – December 2012 = 100.
2 Year-on-Year Inflation Rate for the period ended May 2017.
3 Headline Inflation Rate for the twelve-month period ended May 2017.

Notes: (i) Year-on-Year inflation rate is computed as the change in the CPI for a given month compared with the same month

of the preceding year in percentage terms.

(ii) Headline inflation is measured by comparing the average level of prices, as measured by the CPI, during a twelve-month period

         with the average level during the corresponding previous twelve-month period.

Sources: Statistics Mauritius and Bank of Mauritius.