
Page 21 - May 2017
P. 21
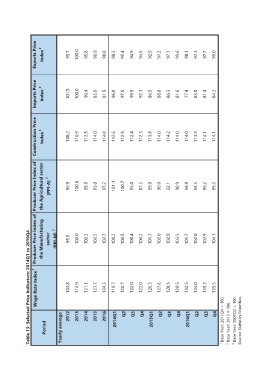
Table 13: Selected Price Indicators: 2014Q1 to 2016Q4

                Wage Rate Index 1 Producer Price Index of Producer Price Index of  Construction Price  Imports Price  Exports Price
                                                                                           Index 3         Index 2        Index 2
Period                         the Manufacturing       the Agricultural sector
                                        sector                  (PPI-A) 2                   108.2            101.5          95.7
                                                                                                             100.0         100.0
                               (PPI-M) 2                                                                     96.4           95.8
                                                                                                             85.9           96.9
Yearly average                                                                                               81.5           98.0
                                                                                                             96.0           98.3
2012            103.8          95.5                    96.9                                                  97.5           95.4
                                                                                                             99.9           94.9
2013            114.9          100.0                   100.0                       110.9                     92.1           94.5
                                                                                                             86.9           92.9
2014            121.1          100.3                   95.9 112.5                                            88.8           97.2
                                                                                                             86.3           97.7
2015            127.7          102.5                   93.0 114.0                                            81.6           99.6
                                                                                                             77.4           98.1
2016            134.3          102.7                   97.2 114.0                                            83.0           97.3
                                                                                                             81.4           97.7
2014Q1          119.7          100.2                   101.1                       112.6                     84.2           99.0
                               100.5                   100.7                       112.5
        Q2 120.7               100.4                   93.0                        112.4
                               100.2                   87.5                        112.3
        Q3 122.0               101.7                   99.9                        113.8
                               102.0                   90.9                        114.0
        Q4 122.0               102.9                   92.1                        114.2
                               103.5                   90.9                        114.0
2015Q1          126.3          101.7                   94.9                        114.0
                               102.0                   94.5                        113.9
        Q2 127.6               102.9                   99.2                        114.1
                               104.1                   99.3                        114.1
        Q3 128.5

        Q4 128.5

2016Q1          132.5

        Q2 134.0

        Q3 135.3

                  Q4 135.5

1 Base Year: 2011Q4 = 100.
2 Base Year: 2013 = 100.
3 Base Year: 2009Q2 = 100.
Source: Statistics Mauritius.