Page 23 - May 2017
P. 23

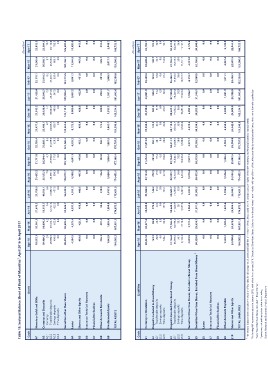
Table 15: Sectoral Balance Sheet of Bank of Mauritius1: April 2016 to April 2017

Code                         Assets                           Apr-16 May-16 Jun-16                   Jul-16       Aug-16       Sep-16       Oct-16       Nov-16       Dec-16       Jan-17                                                                   Feb-17       Mar-17       (Rs million)
                                                                                                                                                                                                                                                                                      Apr-17

A1 Monetary Gold and SDRs                                     18,612.1 18,101.3 21,676.3 21,780.9 21,453.2 21,711.8 22,705.4 21,477.5 21,012.2 21,420.0 22,119.1 21,845.4 22,012.8

A2 Currency and Deposits                                      50,480.2     50,099.5     53,155.7     49,591.1     25,953.3     30,204.4     25,868.1     25,486.1     29,336.4     25,846.7                                                                 25,910.3     26,968.7     23,904.2
A2.1 Currency                                                         2.9          4.2          5.6          6.6          7.9          6.7          8.3          0.7          1.7          7.3                                                                      8.2          9.7        10.7
A2.2 Transferable deposits
A2.3 Savings deposits                                         49,980.5     49,472.7     52,727.8     49,087.2     25,395.1     29,680.8     25,239.6     24,858.6     28,864.9     25,291.8                                                                 25,281.7     26,356.0     23,110.0
A2.4 Time deposits                                                496.8        622.6        422.3        497.3        550.3        517.0        620.3        626.7        469.8        547.5                                                                    620.4        603.1        783.5
                                                                      0.0          0.0          0.0          0.0          0.0          0.0          0.0          0.0          0.0          0.0                                                                      0.0          0.0          0.0
A3 Securities other than Shares
                                                              88,476.5 92,693.4 92,946.7 96,612.5 120,073.7 118,150.8 123,148.2 123,661.4 124,113.2 123,926.7 123,715.5 120,156.1 126,607.0
A4 Loans
                                                              4,584.5      4,575.4      4,597.5      4,591.2      4,588.2      4,601.1      4,595.2      8,172.3      8,089.0      8,057.2                                                                  8,041.7 11,544.6 11,492.8
A5 Shares and Other Equity
                                                              419.9        425.1        450.8        449.5        447.0        449.0        455.1        456.4        456.6        452.0                                                                    451.0        447.6        443.8
A6 Insurance Technical Reserves
                                                              0.0 0.0 0.0 0.0 0.0 0.0 0.0 0.0 0.0 0.0 0.0 0.0 0.0
A7 Financial Derivatives
                                                              0.0 0.0 0.0 0.0 0.0 0.0 0.0 0.0 0.0 0.0 0.0 0.0 0.0
A8 Other Accounts Receivable
                                                              246.1        201.4        94.6         579.0        116.3        132.8        146.1        174.5        309.9        209.4                                                                    201.8        226.7        213.2
A9 Nonfinancial Assets
                                                              1,842.9      1,855.3      1,950.8      1,817.2      1,820.3      1,858.4      1,867.3      1,867.7      1,917.1      1,931.7                                                                  1,949.7      2,017.7      2,048.7
           TOTAL ASSETS
                                                              164,662.2 167,951.3 174,872.5 175,421.3 174,452.1 177,108.4 178,785.5 181,296.0 185,234.3 181,843.6 182,389.0 183,206.9 186,722.5

Code                         Liabilities                      Apr-16 May-16 Jun-16                   Jul-16       Aug-16       Sep-16       Oct-16       Nov-16       Dec-16       Jan-17                                                                   Feb-17       Mar-17       (Rs million)
                                                                                                                                                                                                                                                                                      Apr-17

L1 Currency in Circulation                                    30,447.6 30,571.6 30,580.8 31,022.9 31,154.8 31,412.2 31,813.9 31,992.0 35,918.4 34,021.8 33,440.6 33,640.4 33,183.7

L2 Deposits Included in Broad Money                           161.3        89.8         179.9        146.2        272.5        201.0        108.1        123.3        501.9        100.1                                                                    123.2        188.7        124.2
L2.1 Transferable deposits                                      20.8       20.8           22.4         23.2         25.5         37.4         40.1         42.5         31.9         31.2                                                                     32.0         34.7         30.5
L2.2 Savings deposits                                            0.0                       0.0          0.0          0.0          0.0          0.0          0.0          0.0          0.0                                                                      0.0          0.0          0.0
L2.3 Time deposits                                                           0.0                                                              68.0         80.8                      68.9                                                                     91.2                      93.7
                                                              140.4        69.0         157.6        123.1        247.0        163.6                                  470.1                                                                                              154.0

L3 Deposits Excuded from Broad Money                          74,156.0     77,765.3     80,644.4     80,603.7     82,223.7     83,744.2     84,213.7     88,118.8     88,441.5     87,190.0                                                                 86,446.3     87,765.2     94,547.0
L3.1 Transferable deposits                                    65,995.6     70,596.4     71,028.9     71,238.3     72,748.9     73,340.1     74,509.6     78,514.7     77,932.4     75,207.0                                                                 75,656.6     76,515.5     83,297.3
L3.2 Savings deposits
L3.3 Time deposits                                                  58.1         58.1         58.1         58.0         58.0         58.0         58.0         58.0         58.0         58.0                                                                     58.0         58.0         58.0
                                                                8,102.3      7,110.8      9,557.4      9,307.4      9,416.8    10,346.0       9,646.0      9,546.0    10,451.0     11,924.9                                                                 10,731.7     11,191.7     11,191.7

L4 Securities Other than Shares, Included in Broad Money      3,818.9      3,717.5      3,862.4      3,937.9      3,878.4      3,977.1      3,977.7      3,978.3      4,091.6      3,914.7                                                                  4,110.7      4,221.0      4,175.4
L5 Securities Other than Shares, Excluded from Broad Money 2
                                                              30,329.0 29,634.7 31,971.9 31,905.3 30,472.8 30,379.9 30,385.2 30,390.3 30,283.0 31,546.1 32,860.5 32,756.8 30,508.8

L6 Loans                                                      0.0 0.0 0.0 0.0 0.0 0.0 0.0 0.0 0.0 0.0 0.0 0.0 0.0

L7 Insurance Technical Reserves                               0.0 0.0 0.0 0.0 0.0 0.0 0.0 0.0 0.0 0.0 0.0 0.0 0.0

L8 Financial Derivatives                                      0.0 0.0 0.0 0.0 0.0 0.0 0.0 0.0 0.0 0.0 0.0 0.0 0.0

L9 Other Accounts Payable                                     1,658.7      1,593.5      1,637.6      1,872.2      1,516.6      1,586.4      2,183.1      2,250.2      2,308.1      1,881.9                                                                  1,911.1      2,037.4      2,139.0

L10 Shares and Other Equity                                   24,090.8 24,578.9 25,995.4 25,933.1 24,933.2 25,807.5 26,103.8 24,442.9 23,689.9 23,188.9 23,496.7 22,597.5 22,044.5

      TOTAL LIABILITIES                                       164,662.2 167,951.3 174,872.5 175,421.3 174,452.1 177,108.4 178,785.5 181,296.0 185,234.3 181,843.6 182,389.0 183,206.9 186,722.5

1 The sectoral balance sheet contains the stock and flow data for all categories of assets and liabilities of the Bank of Mauriitus based on the concepts and principles of the IMF Monetary and Financial Statistics Manual (2000).
2 Following IMF recommendations in January 2013, with effect from January 2010, "Securities Other than Shares, Excluded from Broad Money" now include holdings of Bank of Mauritius securities by social security funds, which were formerly classified as
"Securities Other than Shares, Included in Broad Money".
Figures may not add up to totals due to rounding.
Source: Research and Economic Analysis Department.
   18   19   20   21   22   23   24   25   26   27   28