
Page 29 - May 2017
P. 29
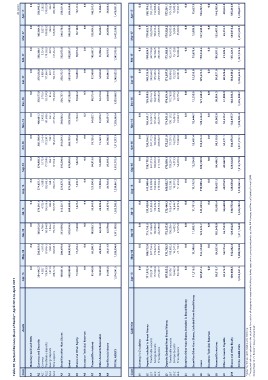
Table 20: Sectoral Balance Sheet of Banks*: April 2016 to April 2017
Code Assets Apr-16 May-16 Jun-16 Jul-16 Aug-16 Sep-16 Oct-16 Nov-16 Dec-16 Jan-17 Feb-17 Mar-17 (Rs million)
Apr-17
A1 Monetary Gold and SDRs 0.0 0.0 0.0 0.0 0.0 0.0 0.0 0.0 0.0 0.0 0.0 0.0
0.0
A2 Currency and Deposits 384,443.7 386,852.9 369,812.6 379,691.1 374,032.1 374,968.3 368,798.9 406,061.3 376,577.8 376,956.8 366,380.1 382,604.9
A2.1 Currency 4,582.1 4,861.8 4,708.4 4,722.4 4,980.9 5,172.9 5,246.4 5,483.2 6,792.4 6,089.4 5,524.6 5,827.1 386,605.5
A2.2 Transferable deposits 5,265.9
A2.3 Savings deposits 178,043.3 191,064.9 185,944.8 186,318.3 182,495.3 177,390.6 177,330.7 181,689.6 195,730.9 177,666.7 178,593.3 189,839.2
A2.4 Time deposits 1,071.3 1,031.2 1,026.4 882.9 938.1 854.7 790.7 934.1 816.4 822.7 897.9 1,069.4 170,813.0
926.1
A3 Securities other than Shares 200,747.0 189,895.1 178,133.1 187,767.5 185,617.8 191,550.1 185,431.0 217,954.4 173,238.2 192,378.1 181,364.2 185,869.2
209,600.6
A4 Loans 198,021.6 200,493.0 213,939.8 218,831.7 221,872.3 216,290.0 218,819.3 218,862.2 229,727.1 228,272.7 232,873.8 249,278.8
238,221.8
A5 Shares and Other Equity 558,580.0 560,934.5 570,910.3 580,688.6 574,209.7 578,903.9 582,193.5 579,170.8 581,392.8 591,594.9 592,291.7 595,538.8
594,650.9
A6 Insurance Technical Reserves 11,438.2 11,458.2 7,590.0 7,821.4 7,818.7 7,822.0 7,765.6 7,736.4 10,694.2 10,689.2 10,615.0 10,138.6
10,147.4
A7 Financial Derivatives 0.0 0.0 0.0 0.0 0.0 0.0 0.0 0.2 0.3 0.0 0.0 0.0
0.0
A8 Other Accounts Receivable 81,449.8 85,208.7 103,853.1 95,661.9 121,396.8 94,913.6 91,125.2 84,622.1 98,215.4 97,568.8 105,697.7 135,024.2
143,553.1
A9 Nonfinancial Assets 18,444.0 22,033.2 22,494.0 22,836.2 17,003.2 14,480.0 15,724.1 15,978.7 12,413.6 12,046.8 13,002.2 13,296.7
11,066.7
TOTAL ASSETS 21,864.3 22,413.5 22,570.0 22,671.4 22,728.6 25,395.2 26,786.5 26,871.7 26,869.6 26,494.1 26,515.1 26,656.0
26,446.3
1,274,241.5 1,289,394.0 1,311,169.8 1,328,202.2 1,339,061.3 1,312,772.9 1,311,213.1 1,339,303.4 1,335,890.7 1,343,623.3 1,347,375.6 1,412,538.1
1,410,691.7
Code Liabilities Apr-16 May-16 Jun-16 Jul-16 Aug-16 Sep-16 Oct-16 Nov-16 Dec-16 Jan-17 Feb-17 Mar-17 Apr-17
L1 Currency in Circulation 0.0 0.0 0.0 0.0 0.0 0.0 0.0 0.0 0.0 0.0 0.0 0.0 0.0
L2 Deposits Included in Broad Money 711,072.4 700,772.0 715,155.3 731,038.0 741,060.4 738,118.3 736,954.2 763,451.7 739,958.5 749,135.0 750,624.1 770,633.1 758,116.2
L2.1 Transferable deposits 318,281.8 307,756.5 311,866.0 337,865.3 339,389.8 341,319.3 341,112.5 343,047.2 335,746.1 343,648.2 347,744.6 355,200.4 351,910.7
L2.2 Savings deposits 177,303.0 176,621.8 180,899.2 183,409.3 184,966.2 186,062.8 186,808.8 187,427.3 194,558.5 195,933.5 197,842.5 198,613.2 199,308.3
L2.3 Time deposits 215,487.7 216,393.7 222,390.0 209,763.4 216,704.4 210,736.1 209,032.9 232,977.3 209,653.9 209,553.3 205,037.0 216,819.5 206,897.2
L3 Deposits Excluded from Broad Money 167,625.2 171,783.5 172,367.6 173,440.3 169,852.7 179,850.1 175,221.9 174,561.9 174,854.0 171,367.6 173,383.6 176,329.2 177,501.1
L3.1 Transferable deposits 100,706.1 108,382.5 108,296.4 106,417.3 102,198.1 109,294.5 107,201.5 108,150.2 110,760.0 109,964.5 105,617.6 104,935.3 104,163.4
L3.2 Savings deposits
L3.3 Time deposits 16,462.4 16,241.3 16,455.2 16,646.7 16,301.9 16,319.9 16,079.6 16,487.6 15,318.9 15,322.1 15,129.6 15,584.3 15,942.0
50,456.8 47,159.7 47,615.9 50,376.3 51,352.6 54,235.6 51,940.8 49,924.1 48,775.2 46,081.0 52,636.4 55,809.6 57,395.7
L4 Securities Other than Shares, Included in Broad Money 0.0 0.0 0.0 0.0 0.0 0.0 0.0 0.0 0.0 0.0 0.0 0.0 0.0
L5 Securities Other than Shares, Excluded from Broad Money 11,216.2 11,308.6 11,682.1 11,781.9 11,112.9 12,324.0 12,437.4 12,444.7 12,259.5 12,253.0 12,678.6 12,089.9 11,637.9
L6 Loans 122,851.5 134,314.8 123,523.7 131,633.5 118,899.4 108,768.9 113,615.3 120,446.3 127,260.2 129,572.3 118,344.5 127,648.9 133,267.2
L7 Insurance Technical Reserves 0.0 0.0 0.0 0.0 0.0 0.0 0.0 0.0 0.0 0.0 0.0 0.0 0.0
L8 Financial Derivatives 80,813.7 84,857.0 102,648.8 95,096.4 120,627.3 94,406.3 90,138.9 83,962.0 98,054.3 98,021.9 105,597.3 135,487.8 144,302.4
L9 Other Accounts Payable 50,575.9 54,115.6 56,759.9 54,640.0 48,874.9 49,662.8 52,371.1 52,419.2 51,000.9 48,924.4 51,326.3 56,333.1 50,652.0
L10 Shares and Other Equity 130,086.5 132,242.4 129,032.6 130,572.0 128,633.8 129,642.6 130,474.3 132,017.7 132,503.3 134,349.2 135,421.1 134,016.2 135,214.9
TOTAL LIABILITIES 1,274,241.5 1,289,394.0 1,311,169.8 1,328,202.2 1,339,061.3 1,312,772.9
1,311,213.1 1,339,303.4 1,335,890.7 1,343,623.3 1,347,375.6 1,412,538.1 1,410,691.7
Figures may not add up to totals due to rounding.
* The sectoral balance sheet contains the stock and flow data for all categories of assets and liabilities of banks, based on the concepts and principles of the IMF Monetary and Financial Statistics Manual (2000).
Source: Research and Economic Analysis Department.