
Page 30 - May 2017
P. 30
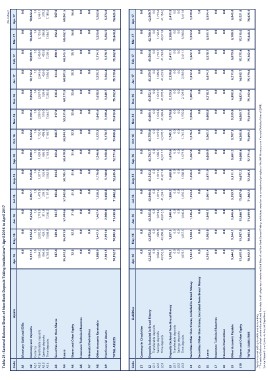
Table 21: Sectoral Balance Sheet of Non-Bank Deposit-Taking Institutions*: April 2016 to April 2017
Code Assets Apr-16 May-16 Jun-16 Jul-16 Aug-16 Sep-16 Oct-16 Nov-16 Dec-16 Jan-17 Feb-17 Mar-17 (Rs million)
Apr-17
A1 Monetary Gold and SDRs 0.0 0.0 0.0 0.0 0.0 0.0 0.0 0.0 0.0 0.0 0.0 0.0 0.0
A2 Currency and Deposits 9,517.1 9,612.2 9,272.2 8,967.1 9,468.0 9,490.7 9,422.2 9,705.3 9,854.0 10,112.2 10,099.7 10,228.6 10,022.2
A2.1 Currency 1.3 1.3 1.5 1.6 1.6 1.3 1.6 1.6 1.4 1.5 1.5 1.3 1.5
A2.2 Transferable deposits
A2.3 Savings deposits 1,864.2 2,082.9 1,719.0 1,479.5 1,877.4 1,639.9 1,752.4 2,081.0 2,057.8 2,645.6 2,453.0 2,155.8 2,461.1
A2.4 Time deposits 866.6 429.1 311.6 299.1 526.4 686.3 498.6 576.0 509.4 428.6 435.8 386.8 379.2
6,785.0 7,098.9 7,240.2 7,187.0 7,062.5 7,163.2 7,169.7 7,046.7 7,285.4 7,036.4 7,209.4 7,684.7 7,180.4
A3 Securities other than Shares 367.4 369.0 364.7 363.6 364.5 363.2 366.7 317.0 336.3 334.6 490.1 392.2 567.6
A4 Loans 56,243.2 56,491.9 57,404.6 57,842.8 58,105.7 58,470.9 58,944.1 59,331.0 60,171.9 60,201.5 60,345.7 60,482.7 60,861.5
A5 Shares and Other Equity 32.6 32.2 31.0 31.3 31.4 31.4 32.3 32.6 32.6 33.3 33.7 34.0 34.4
A6 Insurance Technical Reserves 0.0 0.0 0.0 0.0 0.0 0.0 0.0 0.0 0.0 0.0 0.0 0.0 0.0
A7 Financial Derivatives 0.0 0.0 0.0 0.0 0.0 0.0 0.0 0.0 0.0 0.0 0.0 0.0 0.0
A8 Other Accounts Receivable 1,690.9 1,447.5 1,467.4 1,558.5 1,176.0 1,246.8 1,123.3 1,045.6 1,538.5 1,233.7 1,114.7 1,226.0 1,262.8
A9 Nonfinancial Assets 2,961.5 2,951.0 2,960.0 3,038.8 3,100.0 3,168.6 3,170.7 3,188.4 3,248.7 3,264.4 3,278.7 3,284.5 3,274.8
TOTAL ASSETS 70,812.7 70,903.8 71,499.9 71,802.2 72,245.5 72,771.6 73,059.2 73,619.9 75,182.0 75,179.6 75,362.8 75,648.2 76,023.3
Code Liabilities Apr-16 May-16 Jun-16 Jul-16 Aug-16 Sep-16 Oct-16 Nov-16 Dec-16 Jan-17 Feb-17 Mar-17 Apr-17
L1 Currency in Circulation 0.0 0.0 0.0 0.0 0.0 0.0 0.0 0.0 0.0 0.0 0.0 0.0 0.0
L2 Deposits Included in Broad Money 42,236.5 42,072.8 42,585.8 42,940.6 43,543.2 43,703.7 43,758.0 43,609.1 43,552.1 43,359.5 43,504.0 42,700.3 42,869.7
L2.1 Transferable deposits 0.0 0.0 0.0 0.0 0.0 0.0 0.0 0.0 0.0 0.0 0.0 0.0 0.0
L2.2 Savings deposits
L2.3 Time deposits 1,684.1 1,685.8 1,673.4 1,671.4 1,671.4 1,686.1 1,679.9 1,678.8 1,673.7 1,699.6 1,710.1 1,728.5 1,715.4
40,552.5 40,386.9 40,912.5 41,269.1 41,871.9 42,017.7 42,078.1 41,930.3 41,878.4 41,659.9 41,793.8 40,971.8 41,154.2
L3 Deposits Excluded from Broad Money 1,876.1 1,857.5 1,840.4 1,850.2 1,688.8 1,679.6 1,745.3 1,970.0 2,129.9 2,330.0 2,411.1 3,366.0 3,411.9
L3.1 Transferable deposits 0.0 0.0 0.0 0.0 0.0 0.0 0.0 0.0 0.0 0.0 0.0 0.0 0.0
L3.2 Savings deposits 0.0 0.0 0.0 0.0 0.0 0.0 0.0 0.0 0.0 0.0 0.0 0.0 0.0
L3.3 Time deposits
1,876.1 1,857.5 1,840.4 1,850.2 1,688.8 1,679.6 1,745.3 1,970.0 2,129.9 2,330.0 2,411.1 3,366.0 3,411.9
L4 Securities Other than Shares, Included in Broad Money 1,534.6 1,538.5 1,546.3 1,553.3 1,558.2 1,567.8 1,576.2 1,586.6 1,601.6 1,612.3 1,622.1 1,632.8 1,639.6
L5 Securities Other than Shares, Excluded from Broad Money 0.0 0.0 0.0 0.0 0.0 0.0 0.0 0.0 0.0 0.0 0.0 0.0 1.0
L6 Loans 6,105.4 5,993.0 5,840.1 5,961.4 5,871.9 6,050.9 5,963.7 6,008.8 6,218.1 6,674.1 6,570.7 6,535.1 6,534.4
L7 Insurance Technical Reserves 0.0 0.0 0.0 0.0 0.0 0.0 0.0 0.0 0.0 0.0 0.0 0.0 0.0
L8 Financial Derivatives 0.0 0.0 0.0 0.0 0.0 0.0 0.0 0.0 0.0 0.0 0.0 0.0 0.0
L9 Other Accounts Payable 5,644.2 5,844.1 5,846.4 5,599.7 5,511.1 5,681.2 5,707.3 5,935.8 6,858.9 6,211.0 6,079.6 6,100.3 6,045.0
L10 Shares and Other Equity 13,415.9 13,597.9 13,840.7 13,897.0 14,072.2 14,088.4 14,308.8 14,509.7 14,821.4 14,992.7 15,175.4 15,313.6 15,521.8
TOTAL LIABILITIES 70,812.7 70,903.8 71,499.9 71,802.2 72,245.5 72,771.6 73,059.2 73,619.9 75,182.0 75,179.6 75,362.8 75,648.2 76,023.3
Figures may not add up to totals due to rounding.
* The sectoral balance sheet contains the stock and flow data for all categories of assets and liabilities of the Non-Bank Deposit Taking Institutions based on the concepts and principles of the IMF Monetary and Financial Statistics Manual (2000).
Source: Research and Economic Analysis Department.