Page 34 - May 2017
P. 34

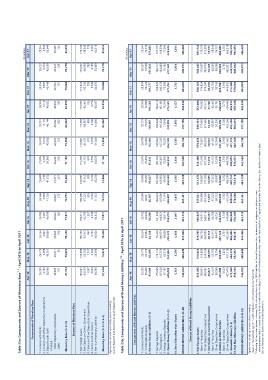
Table 25a: Components and Sources of Monetary Base 1 2 : April 2016 to April 2017

                                                    Apr-16     May-16     Jun-16     Jul-16     Aug-16     Sep-16     Oct-16     Nov-16                                                                                    Dec-16     Jan-17     Feb-17     Mar-17     (Rs million)
                                                                                                                                                                                                                                                                         Apr-17

Components of Monetary Base

1. Currency with Public                             26,255     26,173     26,254     26,762     26,566     26,680     27,086     26,978                                                                                    29,731     28,504     28,354     28,227     28,264
2. Currency with Other Depository Corporations        4,193      4,398      4,327      4,261      4,589      4,733      4,728      5,014                                                                                     6,187      5,518      5,087      5,414      4,920
3. Deposits with BoM
                                                    36,966     45,501     39,839     40,788     41,120     41,672     39,342     43,058                                                                                    46,144     49,052     46,448     42,630     50,649
   of which:
    Other Depository Corporations                   36,805     45,411     39,659     40,642     40,847     41,471     39,234     42,935                                                                                    45,642     48,952     46,324     42,441     50,525
    Other                                              161          90       180        146        273        201        108        123                                                                                       502        100        123        189        124

Monetary Base (1+2+3)                               67,414     76,073     70,420     71,811     72,274     73,084     71,156     75,050                                                                                    82,062     83,074     79,888     76,270     83,833

Sources of Monetary Base

1. Net Foreign Assets                               156,601    159,898    166,726    166,911    166,396    169,581    171,299    173,801                                                                                   177,669    174,395    174,924    175,637    179,153
2. Net Claims on Central Government                 -34,519    -29,765    -35,913    -35,783    -37,225    -37,942    -41,152    -41,551                                                                                   -38,387    -32,405    -35,192    -40,506    -39,546
3. Claims on Other Depository Corporations
4. Claims on Other Sectors                             1,067      1,017        867      1,357        876        903        874        872                                                                                       885        765        759        783        778
5. Net Non-Monetary Liabilities                        3,623      3,622      3,761      3,749      3,762      3,762      3,759      3,768                                                                                     3,786      3,776      3,766      3,765      3,761
                                                     59,358     58,698     65,020     64,422     61,535     63,220     63,623     61,840                                                                                    61,890     63,457     64,370     63,409     60,313

  Monetary Base (1+2+3+4-5)                         67,414     76,073     70,420     71,811     72,274     73,084     71,156     75,050                                                                                    82,062     83,074     79,888     76,270     83,833

Figures may not add up to totals due to rounding.
Source: Research and Economic Analysis Department.

Table 25b: Components and Sources of Broad Money Liabilities 1 2 : April 2016 to April 2017

                                                    Apr-16     May-16     Jun-16     Jul-16     Aug-16     Sep-16     Oct-16     Nov-16                                                                                    Dec-16     Jan-17     Feb-17     Mar-17     (Rs million)
                                                                                                                                                                                                                                                                         Apr-17

Components of Broad Money Liabilities

1. Currency with Public                              26,255     26,173     26,254     26,762     26,566     26,680     27,086     26,978                                                                                      29,731     28,504     28,354     28,227     28,264
2. Transferable Deposits                             65,445     66,135     67,934     69,446     68,541     68,957     70,439     70,490                                                                                      72,270     72,999     73,423     73,598     73,718
I. Narrow Money Liabilities (1+2)                   91,699     92,309     94,188     96,208     95,107     95,637     97,525     97,468                                                                                    102,001    101,503    101,777    101,825    101,982

1. Savings Deposits                                  175,665    175,112    179,370    181,453    182,024    184,500    185,123    185,692                                                                                   192,828    193,614    195,829    196,747    197,707
2. Time Deposits                                     107,028    107,756    106,973    108,351    107,689    106,952    106,497    107,237                                                                                   105,324    105,183    106,178    104,483    103,539
3. Foreign Currency Deposits
II. Quasi-Money Liabilities (1+2+3)                    67,167     69,216     69,026     69,614     71,174     69,087     72,930     70,221                                                                                    71,943     76,704     75,286     76,162     77,380
                                                    349,859    352,084    355,370    359,419    360,887    360,539    364,550    363,149                                                                                   370,095    375,501    377,293    377,392    378,626

III. Securities other than Shares                   5,353      5,256      5,409      5,491      5,437      5,545      5,554      5,565                                                                                     5,693      5,527      5,733      5,854      5,815

BROAD MONEY LIABILITIES (I+II+III)                  446,912    449,649    454,966    461,118    461,431    461,720    467,629    466,182                                                                                   477,789    482,530    484,803    485,071    486,423

Sources of Broad Money Liabilities

I. Net Foreign Assets                               525,295    518,022    529,765    536,627    547,521    541,174    541,488    576,673                                                                                   549,151    552,006    550,125    565,447    551,542
   Bank of Mauritius                                 156,601    159,898    166,726    166,911    166,396    169,581    171,299    173,801                                                                                   177,669    174,395    174,924    175,637    179,153
   Other Depository Corporations                     368,694    358,124    363,039    369,716    381,126    371,593    370,189    402,872                                                                                   371,482    377,612    375,200    389,810    372,389
                                                     48,841     48,939     48,559     50,347     51,497     52,695     51,356     50,543                                                                                    54,205     57,786     60,550     58,360     59,555
1. Net Claims on Central Government                  -34,519    -29,765    -35,913    -35,783    -37,225    -37,942    -41,152    -41,551                                                                                   -38,387    -32,405    -35,192    -40,506    -39,546
   Bank of Mauritius
   Other Depository Corporations                       83,360     78,704     84,473     86,131     88,722     90,637     92,508     92,094                                                                                    92,592     90,191     95,742     98,866     99,101
                                                    431,099    435,339    437,123    444,613    439,060    440,062    447,459    441,429                                                                                   439,052    438,225    453,758    466,566    466,980
2. Claims on Other Sectors
   Bank of Mauritius                                    3,623      3,622      3,761      3,749      3,762      3,762      3,759      3,768                                                                                     3,786      3,776      3,766      3,765      3,761
   Other Depository Corporations                     427,476    431,718    433,363    440,864    435,299    436,299    443,700    437,662                                                                                   435,266    434,449    449,992    462,801    463,218
                                                    479,940    484,278    485,682    494,960    490,558    492,757    498,815    491,973                                                                                   493,258    496,012    514,308    524,926    526,535
II. Domestic Claims (1+2)                           558,323    552,651    560,481    570,469    576,648    572,210    572,674    602,464                                                                                   564,619    565,488    579,630    605,302    591,654
III. Net Non-Monetary Liabilities

BROAD MONEY LIABILITES (I+II-III)                   446,912    449,649    454,966    461,118    461,431    461,720    467,629    466,182                                                                                   477,789    482,530    484,803    485,071    486,423

Figures may not add up to totals due to rounding.
1 Based on the methodology of the IMF's Depository Corporations Survey framework.
2 Following IMF recommendations in January 2013, with effect from January 2010, liabilities to Central Government include deposits of budgetary central government,

  extra-budgetary units and social security funds, as well as their holdings of Bank of Mauritius securities, which were formerly classified as "Deposits and Securities Other than Shares, Excluded from Monetary Base".

Source: Research and Economic Analysis Department.
   29   30   31   32   33   34   35   36   37   38   39