
Page 35 - May 2017
P. 35
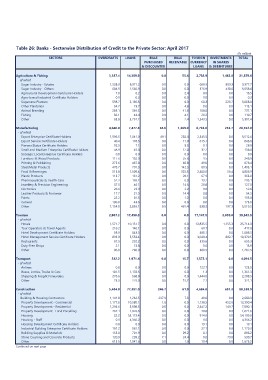
Table 26: Banks - Sectorwise Distribution of Credit to the Private Sector: April 2017
SECTORS OVERDRAFTS LOANS BILLS BILLS FOREIGN INVESTMENTS (Rs million)
PURCHASED RECEIVABLE CURRENCY IN SHARES TOTAL
& DISCOUNTED
LOANS & DEBENTURES
Agriculture & Fishing 3,187.4 14,389.9 0.0 55.4 2,783.9 1,463.0 21,879.6
- of which
Sugar Industry - Estates 1,528.3 6,371.2 0.0 0.0 668.9 809.3 9,377.7
Sugar Industry - Others 684.9 1,566.9 0.0 0.0 376.9 430.0 3,058.8
Agricultural Development Certificate Holders 7.8 0.0 2.4 0.0
Agro-based Industrial Certificate Holders 0.0 6.2 0.0 0.0 0.0 0.0 16.5
Sugarcane Planters 598.7 0.2 0.0 0.0 60.3 0.0 0.2
Other Plantation 34.7 2,185.3 0.0 4.8 0.0 223.7
Animal Breeding 203.1 73.7 0.0 41.8 108.0 0.0 3,068.0
Fishing 36.1 384.3 0.0 4.1 26.2 0.0 113.1
Other 93.8 44.4 0.0 2.4 1,543.5 0.0 737.1
3,757.7 0.0 110.7
5,397.4
Manufacturing 4,640.0 7,477.8 58.6 1,389.0 6,733.0 253.7 20,552.0
- of which
Export Enterprise Certificate Holders 1,596.5 1,041.0 49.1 282.4 2,543.5 0.0 5,512.6
Export Service Certificate Holders 40.4 178.5 0.0 11.9 615.1 0.0 846.0
Pioneer Status Certificate Holders 12.5 7.1 0.0 8.3 0.1 0.0 28.0
Small and Medium Enterprise Certificate Holders 48.9 45.0 0.0 12.0 32.2 0.0 138.0
Strategic Local Enterprise Certificate Holders 0.0 0.0 0.0 0.0 0.0 0.0 0.0
Furniture & Wood Products 102.0 0.0 25.8 3.5 0.0 248.9
Printing & Publishing 117.6 487.0 0.0 66.8 49.0 0.0 878.4
Steel/Metal Products 275.6 701.3 0.0 80.5 0.0
Food & Beverages 478.7 0.0 142.5 56.4 1,403.1
Plastic Products 515.8 1,509.4 0.0 325.3 2,400.0 0.0 4,806.9
Pharmaceuticals & Health Care 113.7 161.2 0.0 67.9 0.0
Jewellery & Precision Engineering 169.7 0.0 20.1 73.2 0.0 363.0
Electronics 52.2 46.1 0.0 0.0 28.8 0.0 295.1
Leather Products & Footwear 37.5 23.9 0.0 0.0 0.0 127.0
Paints 26.6 21.5 0.0 14.6 0.8 0.0
Cement 17.7 81.5 0.0 2.2 0.0 0.0 52.6
Other 22.2 43.6 9.5 0.0 197.3 54.5
130.0 14.4 105.0
1,154.0 2,859.1 1.2 838.3 173.6
0.0 5,519.5
461.4
Tourism 2,907.3 17,450.8 0.0 0.0 17,147.8 2,038.0 39,543.9
- of which
Hotels 1,571.7 10,151.7 0.0 0.0 12,835.5 1,155.3 25,714.3
Tour Operators & Travel Agents 216.2 140.1
Hotel Development Certificate Holders 58.9 543.5 0.0 0.0 60.7 0.0 417.0
Hotel Management Service Certificate Holders 893.9
Restaurants 67.5 5,553.4 0.0 0.0 486.1 0.0 1,088.5
Duty-Free Shops 2.1 252.2
Other 96.9 13.8 0.0 0.0 3,040.4 882.7 10,370.5
796.0
0.0 0.0 335.6 0.0 655.3
0.0 0.0 0.0 0.0 15.9
0.0 0.0 389.5 0.0 1,282.5
Transport 532.2 1,971.4 0.0 15.7 1,575.1 0.0 4,094.5
- of which
Airlines 0.8 0.0 0.0 0.0 122.7 0.0 123.5
Buses, Lorries, Trucks & Cars 181.5 1,178.5 0.0 0.0 1.3 0.0 1,361.3
Shipping & Freight Forwarders 276.6 0.0 0.0 1,444.0 0.0 2,288.5
Other 568.0 0.0 15.7 7.1 0.0 321.1
73.3 225.0
Construction 5,484.0 77,381.0 246.7 61.9 4,684.0 681.3 88,538.9
- of which
Building & Housing Contractors 1,141.8 1,232.5 237.9 7.3 40.6 0.0 2,660.3
Property Development - Commercial 1,177.6 10,580.1 1.6 0.0 1,138.5 452.6 13,350.4
Property Development - Residential 1,294.6 0.0 0.0 2,447.2 149.7
Property Development - Land Parcelling 3,998.5 0.0 0.0 7,890.1
Housing 767.1 1,026.6 0.0 0.0 78.0 0.0 1,871.6
Housing - Staff 22.2 53,173.4 0.0 0.0 914.0 0.0 54,109.6
Housing Development Certificate Holders 0.0 4,366.2 0.0 0.0 0.0 4,366.2
Industrial Building Enterprise Certificate Holders 0.0 0.0 0.0 0.0 0.0
Building Supplies & Materials 0.0 0.0 29.2 19.1 0.0 19.1
Stone Crushing and Concrete Products 191.2 961.1 7.1 24.4 27.1 0.0 1,179.3
Other 155.0 701.9 0.0 1.0 79.0
120.9 299.2 0.1 0.0 886.2
Continued on next page 613.5 1,041.6 0.0 530.7
19.4 1,675.5