
Page 12 - June 2017
P. 12
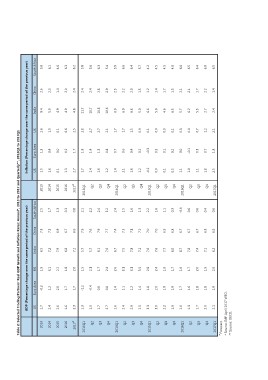
Table 2: Selected Trading Partners' Real GDP Growth and Inflation Rates: Annual*, 2013 to 2017 and Quarterly**, 2013Q1 to 2017Q1

             GDP (Percentage change over the same period of the previous year)          Inflation (Percentage change over the same period of the previous year)

2013         US Euro Area UK              India  China  South Africa            2013    US Euro Area  UK                          India  China  South Africa
             1.7 -0.3 1.9                  6.5    7.8         2.5                       1.5 1.3       2.6                          9.4    2.6         5.8

2014         2.4               1.2   3.1  7.2    7.3    1.7                     2014    1.6   0.4     1.5 5.9 2.0                               6.1

2015         2.6               2.0   2.2  7.9    6.9    1.3                     2015    0.1   0.0     0.1 4.9 1.4                               4.6

2016         1.6               1.7   1.8  6.8    6.7    0.3                     2016    1.3   0.2     0.6 4.9 2.0                               6.3

2017#        2.3               1.7   2.0  7.2    6.6    0.8                     2017#   2.7   1.7     2.5 4.8 2.4                               6.2

2013Q1       1.3               -1.2  1.5  5.7    7.9    2.1                     2013Q1  1.7   1.9     2.8 11.7 2.4                              5.8
                                                                                              1.4     2.7 10.7 2.4                              5.6
Q2 1.0 -0.4 2.1 5.7 7.6                                 2.2 Q2 1.4                            1.3     2.7 10.8 2.8                              6.3
                                                                                              0.8     2.1 10.6 2.9                              5.4
Q3 1.7 0.0 1.7 6.1 7.9                                  2.4 Q3 1.6                            0.7     1.7 6.9 2.3                               5.9
                                                                                              0.6     1.7 6.9 2.2                               6.6
Q4 2.7 0.8 2.4 7.0 7.7                                  3.2 Q4 1.2                            0.4     1.5 6.8 2.0                               6.4
                                                                                              0.2     0.9 5.0 1.5                               5.7
2014Q1       1.6               1.4   2.6  6.7    7.4    2.4                     2014Q1  1.4   -0.3    0.1 6.6 1.2                               4.2
                                                                                              0.2     0.0 5.9 1.4                               4.5
Q2 2.4 1.1 3.1 7.5 7.5                                  1.5 Q2 2.1                            0.1     0.0 4.6 1.7                               4.5
                                                                                              0.2     0.1 6.5 1.5                               4.8
Q3 2.9 1.2 3.1 7.8 7.1                                  1.6 Q3 1.8                            0.0     0.3 5.7 2.1                               6.6
                                                                                              -0.1    0.4 6.2 2.1                               6.5
Q4 2.5 1.4 3.5 7.2 7.2                                  1.3 Q4 1.2                            0.3     0.7 5.3 1.7                               6.4
                                                                                              0.7     1.2 2.7 2.2                               6.9
2015Q1       3.3               1.8   2.8  7.6    7.0    2.2                     2015Q1  -0.1  1.8     2.1 2.4 1.4                               6.5

Q2 3.0 2.0 2.4 7.6 7.0                                  1.6 Q2 0.0

Q3 2.2 1.9 1.8 7.7 6.9                                  1.1 Q3 0.1

Q4 1.9 1.9 1.7 8.0 6.8                                  0.3 Q4 0.5

2016Q1       1.6               1.7   1.6  8.7    6.7    -0.6 2016Q1 1.1

Q2 1.3 1.6 1.7 7.8 6.7                                  0.6 Q2 1.0

Q3 1.7 1.8 2.0 7.4 6.7                                  0.6 Q3 1.1

Q4 2.0 1.8 1.9 7.1 6.8                                  0.4 Q4 1.8

2017Q1       2.1               1.9   2.0  6.2    6.9    0.6                     2017Q1  2.5

# Forecast.

* Source: IMF April 2017 WEO.
** Source: OECD.