
Page 16 - June 2017
P. 16
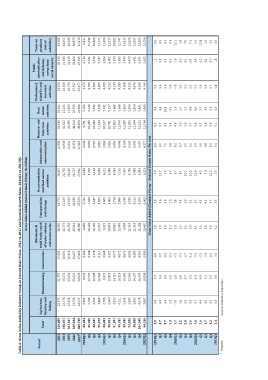
Table 6: Gross Value Added by Industry Group at Current Basic Prices, 2013 to 2017 and Sectoral Growth Rates, 2014Q1 to 2017Q1
Gross Value Added (Current Basic Prices), Rs million
Period Total Agriculture, Manufacturing Wholesale & Transportation Accommodation Financial and Real Professional, Public Taxes on
forestry and retail trade; repair and storage and food service Information and scientific and administration products
2013 Construction and defence;
2014 fishing of motor vehicles activities insurance estate technical (net of
2015 and motorcycles communication activities compulsory subsidies)
2016 social security
20171 activities activities
2014Q1
329,009 12,570 51,787 17,923 38,965 19,779 19,827 14,398 38,336 20,042 14,624 20,196 43,388
Q2 348,011 12,778 53,274 16,631 41,322 21,165 15,923 21,543 44,051
Q3 363,547 12,928 53,436 16,018 41,579 21,160 21,702 14,948 43,599 21,923 16,776 22,419 46,346
Q4 385,364 13,706 53,631 16,027 46,614 22,798 17,917 24,824 48,879
2015Q1 406,735 14,172 54,629 17,493 43,738 22,613 23,520 15,841 49,853 23,690 19,477 25,915 52,930
Q2
Q3 80,681 2,906 9,942 4,184 45,914 24,338 26,727 16,374 9,791 5,236 3,872 4,718 9,834
Q4 85,465 2,748 12,770 4,158 10,232 5,149 4,005 5,611 11,338
2016Q1 86,547 3,256 13,598 4,178 48,496 25,874 27,964 17,019 10,285 5,582 3,982 5,478 10,608
Q2 95,319 3,868 16,963 4,111 11,014 5,198 4,065 5,737 12,271
Q3 84,451 2,788 3,948 8,869 5,281 6,238 3,643 10,527 5,331 4,089 4,924 11,300
Q4 89,021 2,669 9,972 3,921 10,781 5,257 4,212 6,002 11,317
2017Q1 91,307 3,350 12,835 4,077 10,194 4,983 5,202 3,633 10,800 5,668 4,190 5,800 10,982
99,282 4,121 14,110 4,072 11,490 5,668 4,285 5,693 12,747
2014Q1 89,982 2,923 16,519 3,675 10,159 5,387 4,163 3,791 11,280 5,663 4,368 5,499 11,615
Q2 93,582 2,905 10,300 3,632 11,565 5,450 4,510 6,473 12,676
Q3 96,855 3,600 12,696 4,390 12,357 5,509 6,099 3,882 11,544 5,854 4,479 6,481 11,007
Q4 104,945 4,278 14,287 4,330 12,225 5,831 4,560 6,371 13,582
94,256 2,987 16,347 3,980 9,421 5,605 6,511 3,934 11,734 5,963 4,740 5,692 12,796
2015Q1 10,098
Q2 2.9 5.0 -6.0 10,849 5,401 4,986 3,965 6.1 3.3 5.5 1.1 4.1
Q3 4.7 4.4 0.3 -9.7 5.7 4.6 5.6 9.8 6.5
Q4 4.7 3.4 5.4 -9.3 10,820 5,758 4,862 3,894 4.8 16.9 5.6 3.9 4.2
2.3 2.8 3.9 -9.1 5.4 -3.1 5.4 6.2 4.3
2016Q1 3.2 -7.0 -2.0 -7.5 12,648 5,848 7,161 4,048 4.6 2.3 4.8 1.6 12.1
Q2 2.2 1.6 2.6 -7.5 5.0 2.4 5.0 3.0 1.8
Q3 3.0 3.2 -2.6 -2.7 9,894 6,034 7,454 4,133 5.5 1.7 5.2 3.0 7.0
Q4 3.9 0.8 -0.7 -1.8 5.7 9.8 5.3 -2.4 7.1
3.8 5.7 1.5 -7.0 11,414 5,832 5,746 4,102 5.8 6.0 5.7 3.4 5.5
2017Q1 2.6 4.4 -1.3 -7.3 5.7 3.7 5.6 0.0 12.8
1 Forecast 3.7 3.5 -0.9 7.6 11,319 6,212 5,483 3,942 5.6 3.2 5.8 3.2 1.2
4.2 2.5 1.1 6.2 5.6 2.6 5.7 3.0 3.2
3.4 0.3 1.5 7.8 13,288 6,259 8,043 4,197 5.2 4.5 5.8 1.8 4.5
0.0
10,480 6,402 8,023 4,277
Gross Value Added (Constant Prices) - Sectoral Growth Rates, Per cent
2.8 2.8 1.0 6.9
2.8 3.6 11.7 6.0
3.0 3.3 7.5 7.0
3.2 1.9 6.0 5.8
2.8 2.8 9.7 8.2
2.5 3.8 3.1 8.7
3.1 2.9 10.1 5.0
2.9 4.1 10.8 6.2
3.1 3.7 10.8 6.4
3.1 4.3 4.5 5.6
2.9 4.1 7.4 4.8
3.0 3.7 12.3 6.9
3.2 3.5 2.5 5.4
Source: Statistics Mauritius.