
Page 15 - June 2017
P. 15
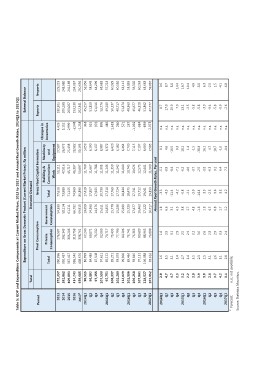
Table 5: GDP and Expenditure Components at Current Market Prices, 2013 to 2017 and Annual Real Growth Rates, 2014Q1 to 2017Q1

                               Expenditure on Gross Domestic Product (Current Market Prices), Rs million                    External Balance

                Total                                      Domestic Demand

     Period                             Final Consumption          Gross Fixed Capital Formation                            Exports  Imports

         2013                  Total    Private  Government        Total     Building &      Machinery      Changes in
         2014                                                       77,618  Construction          and       Inventories
         2015                           Consumption Consumption
         2016                                                                    Work        Equipment               4,429
        20171   372,397        330,896  276,507            54,388                    50,111         27,507                  180,305  229,219
     2014Q1                                                                                                                 200,198  243,980
                392,062 350,457         292,343            58,114 73,989    47,016             26,973       3,152           200,007  241,189
            Q2                                                                                                              193,230  234,087
            Q3  409,893 367,417         306,206            61,211 71,155    45,717             25,438       2,999           202,341  250,656
            Q4
     2015Q1     434,243 386,540         319,758            66,782 74,969    46,387             28,582       -2,048           45,257   52,356
            Q2                                                                                                               51,150   58,643
            Q3  459,665 408,676         338,761            69,915 80,890    50,697             30,193       -1,258           51,016   64,299
            Q4                                                                                                               52,776   68,683
     2016Q1     90,515         80,899   67,240             13,659 17,419    11,760             5,659        363              49,280   57,218
            Q2                                                                                                               50,537   60,329
            Q3  96,802         84,439   69,871             14,568 17,857    11,667             6,190        915              48,717   60,530
            Q4                                                                                                               51,474   63,112
     2017Q1     97,155         87,508   73,232             14,276 17,925    11,788             6,137        978              49,363   53,839
                                                                                                                             45,677   56,302
     2014Q1     107,590        97,611   82,000             15,611 20,790    11,803             8,987        895              46,328   60,263
            Q2                                                                                                               51,862   63,683
            Q3  95,751         85,172   70,717             14,455 17,518    11,146             6,372        486              47,777   59,087
            Q4
                100,337        89,271   73,493             15,778 17,769    11,350             6,420        1,683               0.7      0.6
     2015Q1                                                                                                                   17.0       8.7
            Q2  102,289        93,078   77,790             15,288 17,724    11,542             6,182        260               20.0       8.8
            Q3                                                                                                                         14.4
            Q4  112,029        99,896   84,206             15,690 18,144    11,680             6,464        571                 7.0    16.7
                                                                                                                              13.1     10.4
     2016Q1     101,596        89,460   73,741             15,720 18,475    10,745             7,730        287                -2.5      4.9
            Q2                                                                                                                 -5.8     -3.0
            Q3  106,258        93,840   76,363             17,477 17,741    10,626             7,115        -1,092             -5.8      6.3
            Q4                                                                                                                 -3.9     -2.0
                107,861        97,151   80,689             16,463 19,712    12,575             7,137        -384               -9.4      1.5
     2017Q1                                                                                                                    -5.8     -4.1
1 Forecast.     118,527        106,088  88,965             17,122  19,041   12,441             6,600         -859              -0.9     -6.8
                107,052         93,616  76,899             16,717  19,153   11,569             7,585        2,073              -2.6

                                                           Annual Real Growth Rates, Per cent

                2.9 1.6 1.6 1.8 -3.3 -5.1 0.1 n.a.

                4.7 3.5 2.9 6.6 -4.5 -8.9 4.6 n.a.

                4.7 3.1                 3.1                3.1 -11.4        -8.4 -16.5                      n.a.

                2.3 3.4 2.9 6.5 -4.2 -7.1 0.3 n.a.

                3.2 2.7                 2.5                3.8 -0.8         -6.2 10.1                       n.a.

                2.2 3.4 2.9 5.7 -2.1 -4.0 1.4 n.a.

                3.0 3.5                 3.2                4.8 -2.9         -3.7 -1.5                       n.a.

                3.9 2.3                 3.0                -1.6 -14.4       -2.5 -30.3                      n.a.

                3.8 2.5                 2.6                1.8 3.5          -3.8 16.1                       n.a.

                2.6 3.1 2.8 4.5 -2.3 -6.3 4.7 n.a.

                3.7 2.6                 2.9                0.8 9.6          9.1 10.7                        n.a.

                4.2 3.1                 3.3                1.7 3.8          6.4 -1.0                        n.a.

                3.4 2.8                 2.4                5.2 4.2          7.2 -0.4                        n.a.

                n.a.: not available.

Source: Statistics Mauritius.