
Page 61 - June 2017
P. 61
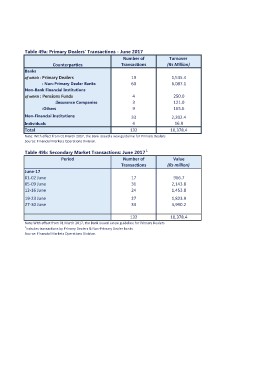
Table 49a: Primary Dealers' Transactions - June 2017

                                     Number of                                              Turnover
                                                                                           (Rs Million)
             Counterparties          Transactions
                                                                                             1,535.4
Banks                                                                                        6,087.1

of which : Primary Dealers           19                                                       250.0
                                                                                              121.0
         : Non-Primary Dealer Banks  60                                                       165.6

Non-Bank Financial Institutions

of which : Pensions Funds            4

             :Insurance Companies    3

         :Others                     9

Non-Financial Institutions           33                                                    2,202.4
                                                                                             16.9
Individuals                          4
                                                                                           10,378.4
Total                                132

Note: With effect from 01 March 2017, the Bank issued a new guideline for Primary Dealers
Source: Financial Markets Operations Division.

Table 49b: Secondary Market Transactions: June 2017 1

                  Period             Number of                                                Value
                                                                                           (Rs million)
                                     Transactions
                                                                                              966.7
June-17                                                                                      2,143.8
                                                                                             1,453.8
01-02 June                           17                                                      1,823.9
                                                                                             3,990.2
05-09 June                           31

12-16 June                           24

19-23 June                           27
27-30 June                           33

                                                                  132                      10,378.4

Note:With effect from 01 March 2017, the Bank issued a new guideline for Primary Dealers
1Includes transactions by Primary Dealers & Non-Primary Dealer banks
Source: Financial Markets Operations Division.