Page 65 - June 2017
P. 65

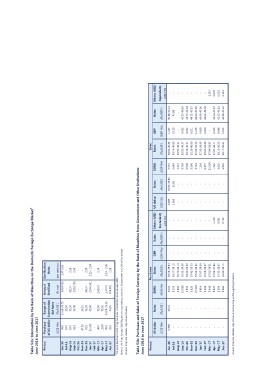
Table 53a: Intervention by the Bank of Mauritius on the Domestic Foreign Exchange Market1
June 2016 to June 2017

Period   Purchase   Range of        Amount Sterilisation

Jun-16   of US dollar Intervention  Sterilised   Rates
 Jul-16
Aug-16              Bid Rates
Sep-16
Oct-16   (US$ Mn)   (Rs/US$ )       (Rs mn)      per cent p.a
Nov-16
Dec-16   96.0 35.60-35.75             3,424.515    2.47-2.62
Jan-17                                   -               -
Feb-17   10.0 35.50
Mar-17   10.0 35.20                  352.0             2.68
Apr-17   43.2 35.48                   1,532.736        2.69
May-17
Jun-17     -          -                  -               -
         47.35      36.15                -               -
                                     905.0             2.80
          55.5      36.20             2,540.361    2.29 - 2.54
         55.595     35.90                -               -
                                    1,420.0            2.58
            -         -                  -               -
                                    1,577.0       2.24 - 2.45
         40.0       35.50           700.485            2.18
         118.0      35.02

         45.0 35.00-35.10
         25.0 34.85

The Bank has been conducting sterilised intervention since January 2015
Note 1 : As from January 2016 figures exclude transactions with Government and Other Institutions
Source: Financial Markets Operations Division

Table 53b: Purchases and Sales of Foreign Currency by the Bank of Mauritius from Government and Other Institutions
June 2016 to June 2017

Period   US dollar    Rates           EURO       Purchases                 GBP                     Rates Others (USD  US dollar     Rates       EURO        Sales       GBP       Rates     Others (USD
                                                       Rates                                                                                              Rates      (GBP Mn)
Jun-16   (US$ Mn)   (Rs/US$ )       (EUR Mn)                               (GBP Mn) (Rs/GBP )      Equivalent)        (US$ Mn)   (Rs/US$ )    (EUR Mn)                         (Rs/GBP )     Equivalent)
 Jul-16                                              (Rs/EUR )                                                                                          (Rs/EUR )                             (US$ Mn)
Aug-16       0.398     35.21           10.05                                     --                  (US$ Mn)             4.489  35.60-35.85     2.575                         50.48-52.11           -
Sep-16          -         -            0.293        38.58-39.94                  --                        -              1.663      35.85       0.649  38.84-40.84  1.247         47.86             -
Oct-16          -         -            0.961        38.57-39.19                  --                        -                            -        1.211  39.44-40.00  0.129            -              -
Nov-16          -         -           15.598        38.71-39.44                                            -                 -          -        8.769  39.59-40.34                                  -
Dec-16          -         -            0.931        38.92-39.38                                                              -          -        0.504  39.81-40.27     -      46.32-46.38           -
Jan-17          -         -            5.629        38.40-39.39            --                      -                         -          -        3.800  39.28-40.24  0.082     43.72-44.28           -
Feb-17          -         -           27.903        37.41-39.79            --                      -                         -          -        3.714  38.26-40.69  0.332     44.71-45.37           -
Mar-17          -         -            0.414        37.03-38.32                                                              -          -        1.214  37.88-39.19  0.321     44.69-45.89           -
Apr-17          -         -            0.294        37.07-38.04            --                      -                         -          -        0.377  37.91-38.95  1.226     43.68-45.30           -
May-17          -         -            5.348        37.08-38.07            --                      -                         -          -       12.314  38.05-38.86  0.699     44.66-44.98        1.215
Jun-17          -         -            0.607        37.00-38.01            --                      -                         -          -        1.226  37.84-38.87  0.390                        0.020
                -         -            0.504        37.03-37.86                                                              -          -        3.626  37.87-38.71                   -           0.032
                -         -            9.069        37.31-38.67            --                      -                         -          -        3.855  38.19-39.55     -      44.94-45.87        0.112
                                                    38.30-39.15            --                      -                         -                          39.17-40.04  0.255     45.62-45.81
                                                                                                                                                                     0.048     44.38-45.22
                                                                           - - 4.459                                                                                 1.105
                                                                           - - 0.001
                                                                           - - 0.710

Source: Financial Markets Operations & Accounting and Budgeting Divisions
   60   61   62   63   64   65   66   67   68   69   70