
Page 69 - June 2017
P. 69
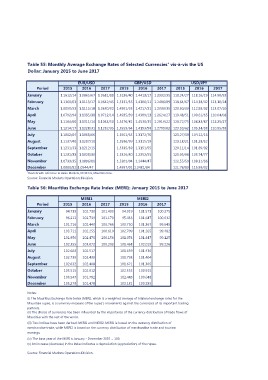
Table 55: Monthly Average Exchange Rates of Selected Currencies1 vis-à-vis the US
Dollar: January 2015 to June 2017

       Period             EUR/USD                                                GBP/USD                        USD/JPY
               2015 2016 2017                                         2015 2016 2017                 2015 2016 2017

January        1.1612/14 1.0865/67 1.0631/33 1.5136/40 1.4413/17 1.2332/35 118.24/27 118.16/19 114.90/93

February       1.1360/63 1.1113/17 1.0642/45 1.5331/35 1.4306/11 1.2486/89 118.64/67 114.38/42 113.10/14

March          1.0850/53 1.1115/18 1.0680/82 1.4991/95 1.4217/21 1.2333/35 120.30/33 112.98/02 113.07/10

April          1.0792/94 1.1335/38 1.0712/14 1.4935/39 1.4309/13 1.2624/27 119.48/51 109.61/65 110.04/08

May            1.1164/66 1.1311/14 1.1048/50 1.5476/81 1.4530/35 1.2919/22 120.72/75 108.83/87 112.25/27

June           1.1214/17 1.1228/31 1.1232/35 1.5559/64 1.4193/98 1.2799/02 123.59/62 105.34/38 110.85/88

July           1.1002/04 1.1063/66                                    1.5561/65 1.3172/76            123.27/30 104.12/16

August         1.1137/40 1.1207/10                                    1.5596/99 1.3115/19            123.18/21 101.28/32

September      1.1231/33 1.1212/15                                    1.5335/39 1.3151/55            120.11/14 101.89/92

October        1.1231/33 1.1028/30                                    1.5326/30 1.2352/55            120.05/08 103.74/77

November       1.0733/35 1.0806/08                                    1.5201/04 1.2444/47            122.55/59 108.31/36

December       1.0880/82 1.0544/47                                    1.4997/01 1.2481/84            121.76/80 115.99/02

1Reuters with reference to Asian Markets, 09 30 hrs, Mauritian time.

Source: Financial Markets Operations Division.

Table 56: Mauritius Exchange Rate Index (MERI): January 2015 to June 2017

       Period  2015  MERI1                      2017                  2015  MERI2          2017
January               2016                      101.439                      2016          100.275
February                                        101.170                                    100.032
March          94.738 102.738                   100.766               94.019 101.573         99.645
April                                           100.610                                      99.482
May            96.211 102.739                   100.156               95.433 101.647         99.125
June                                            100.203                                      99.226
July           101.716 102.440                                        100.750 101.367
August
September      103.711 102.255                                        102.709 101.265
October
November       101.956 102.470                                        101.074 101.447
December
               102.355 103.072                                        101.468 102.019

               102.608 102.517                                        101.659 101.430

               102.739 102.438                                        101.798 101.404

               102.632 102.408                                        101.671 101.365

               103.515 102.012                                        102.555 100.915

               103.547 101.792                                        102.445 100.648

               103.279 101.478                                        102.181 100.285

Notes:

(i) The Mauritius Exchange Rate Index (MERI), which is a weighted average of bilateral exchange rates for the
Mauritian rupee, is a summary measure of the rupee's movements against the currencies of its important trading
partners.
(ii) The choice of currencies has been influenced by the importance of the currency distribution of trade flows of
Mauritius with the rest of the world.

(iii) Two indices have been derived: MERI1 and MERI2. MERI1 is based on the currency distribution of
merchandise trade, while MERI2 is based on the currency distribution of merchandise trade and tourism
earnings.

(iv) The base year of the MERI is January - December 2007 = 100.
(v) An increase (decrease) in the index indicates a depreciation (appreciation) of the rupee.

Source: Financial Markets Operations Division.