
Page 62 - May 2017
P. 62
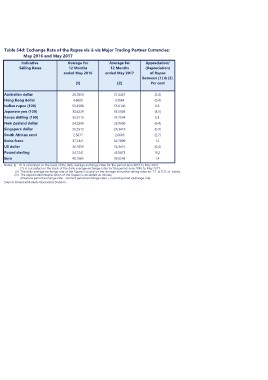
Table 54d: Exchange Rate of the Rupee vis-à-vis Major Trading Partner Currencies:
             May 2016 and May 2017

 Indicative              Average for     Average for    Appreciation/
Selling Rates             12 Months       12 Months     (Depreciation)
                      ended May 2016  ended May 2017
                                                            of Rupee
                               [1]             [2]    between [1] & [2]

                                                            Per cent

Australian dollar     26.7856         27.4461         (2.4)
Hong Kong dollar      4.6883          4.7064          (0.4)
Indian rupee (100)    55.4508         55.0146         0.8
Japanese yen (100)    30.8229         33.6905         (8.5)
Kenya shilling (100)  35.9119         35.7994         0.3
New Zealand dollar    24.2896         25.9609         (6.4)
Singapore dollar      26.2512         26.3419         (0.3)
South African rand    2.5877          2.6605          (2.7)
Swiss franc           37.2321         36.7899         1.2
US dollar             36.1859         36.3416         (0.4)
Pound sterling        54.1241         46.5673         16.2
Euro                  40.1665         39.6245         1.4

Notes: (i) [1] is calculated on the basis of the daily average exchange rates for the period June 2015 to May 2016.
                [2] is calculated on the basis of the daily average exchange rates for the period June 2016 to May 2017.

           (ii) The daily average exchange rate of the Rupee is based on the average indicative selling rates for T.T. & D.D. of banks.
          (iii) The appreciation/depreciation of the Rupee is calculated as follows:

                (Previous period exchange rate - Current period exchange rate) ÷ Current period exchange rate.

Source: Financial Markets Operations Division.