
Page 58 - May 2017
P. 58
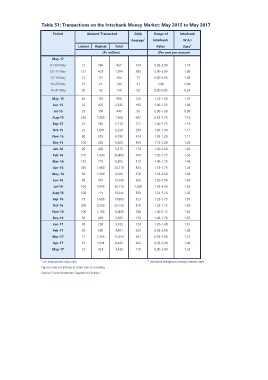
Table 51: Transactions on the Interbank Money Market: May 2015 to May 2017

  Period        Amount Transacted                           Daily   Range of   Interbank
                                                          Average1
 May-17                                                             Interbank  W.A.I
01-04 May
05-11 May  Lowest  Highest                        Total             Rates      Rate2
12-18 May
19-25 May          (Rs million)                                     (Per cent per annum)
26-31 May
           21 396 657                                     164       0.95-2.90  1.19
           121 421 1,994                                  285       0.90-2.90  1.09
           21 121 494                                     71        0.90-2.90  1.48
           21 21 144                                      21                   2.90
           50 50 250                                      50           2.90    0.93
                                                                    0.90-0.95

May-15     40 165 960                                     120       1.25-1.90  1.47
Jun-15                                                              1.00-1.25  1.06
 Jul-15    25 425 2,335 195                                         0.90-1.00  0.99
Aug-15                                                              0.85-1.75  1.10
Sep-15     25 100 445                                     56        1.00-1.75  1.18
Oct-15                                                              1.00-1.30  1.11
Nov-15     250 1,880 7,560                                687       1.05-1.20  1.11
Dec-15                                                              1.15-2.00  1.28
Jan-16     16 530 5,116 222                                         1.20-2.00  1.60
Feb-16                                                              1.20-1.75  1.56
Mar-16     25      1,095                          6,250   298       1.40-1.70  1.46
Apr-16                                                              1.35-1.75  1.45
May-16     80 515 8,780 314                                         1.25-2.00  1.58
Jun-16                                                              1.20-1.90  1.38
 Jul-16    100 555 9,405                                  303       1.65-4.00  2.63
Aug-16                                                              1.35-1.70  1.42
Sep-16     20 420 5,370 173                                         1.25-1.75  1.37
Oct-16                                                              1.25-1.75  1.39
Nov-16     105     1,830                          20,405  704       1.40-2.15  1.66
Dec-16                                                              1.40-1.70  1.52
Jan-17     125 775 8,305                                  319       1.20-1.40  1.31
Feb-17                                                              0.95-2.90  1.08
Mar-17     250     1,980                          24,710  824       0.95-2.90  1.15
Apr-17                                                              0.95-2.90  1.09
May-17     30      1,980                          4,920   378       0.90-2.90  1.23

           30      975 13,740                             528

           100     2,830                          30,170  1,006

           100 775 10,245 330

           75      1,005                          13,065  523

           200     2,010                          25,120  810

           100     1,780                          16,430  548

           50 420 5,285 170

           50 250 3,100 124

           50 600 4,891 233

           71      1,206                          15,526  501

           21      1,041                          8,445   282

           21 421 3,538 118

1 For transactions days only.                                       2 Interbank Weighted Average Interest Rate.
Figures may not add up to totals due to rounding
Source: Financial Markets Operations Division.