
Page 60 - May 2017
P. 60
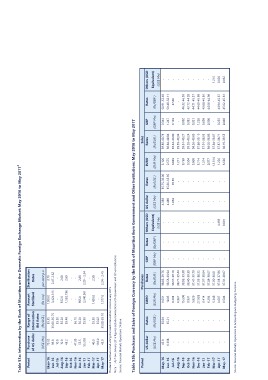
Table 53a: Intervention by the Bank of Mauritius on the Domestic Foreign Exchange Market: May 2016 to May 20171

Period    Purchase Range of              Amount Sterilisation
         of US dollar Intervention
May-16                                   Sterilised   Rates
Jun-16                        Bid Rates
 Jul-16
Aug-16   (US$ Mn)   (Rs/US$ )            (Rs mn)      per cent p.a
Sep-16
Oct-16   73.05          35.35            1,000.0           3.70
Nov-16    96.0      35.60-35.75            3,424.515    2.47-2.62
Dec-16    10.0
Jan-17    10.0          35.50                 -               -
Feb-17    43.2          35.20             352.0            2.68
Mar-17                  35.48              1,532.736       2.69
Apr-17      -
May-17   47.35             -                  -               -
          55.5          36.15                 -               -
         55.595         36.20             905.0            2.80
                        35.90              2,540.361   2.29 - 2.54
            -                                 -               -
          40.0             -             1,420.0           2.58
         118.0          35.50                 -               -
          45.0          35.02            1,577.0       2.24 - 2.45
                    35.00-35.10

The Bank has been conducting sterilised intervention since January 2015
Note 1 : As from January 2016 figures exclude transactions with Government and Other Institutions
Source: Financial Markets Operations Division.

Table 53b: Purchases and Sales of Foreign Currency by the Bank of Mauritius from Government and Other Institutions: May 2016 to May 2017

Period   US dollar    Rates                EURO       Purchases             GBP                    Rates Others (USD  US dollar     Rates       EURO     Sales       GBP       Rates     Others (USD
                                                            Rates                                                                                       Rates
May-16   (US$ Mn)   (Rs/US$ )            (EUR Mn)                                                                     (US$ Mn)   (Rs/US$ )    (EUR Mn)                      (Rs/GBP )     Equivalent)
Jun-16                                                    (Rs/EUR )         (GBP Mn) (Rs/GBP )     Equivalent)                                          (Rs/EUR ) (GBP Mn)                 (US$ Mn)
 Jul-16      45.0      35.04                0.631                                                    (US$ Mn)            4.338   35.75-36.00     3.106                      50.91-52.40           -
Aug-16      0.398      35.21                10.05        38.85-39.76              --                       -             4.489   35.60-35.85     2.575  39.85-40.73  0.344  50.48-52.11           -
Sep-16                                      0.293        38.58-39.94              --                       -             1.663                   0.649  38.84-40.84  1.247                        -
Oct-16         -          -                 0.961        38.57-39.19              --                       -                         35.85       1.211  39.44-40.00  0.129      47.86             -
Nov-16         -          -                15.598        38.71-39.44              --                       -                -           -        8.769  39.59-40.34                -              -
Dec-16         -          -                 0.931        38.92-39.38              --                       -                -           -        0.504  39.81-40.27     -                         -
Jan-17         -          -                 5.629        38.40-39.39              --                       -                -           -        3.800  39.28-40.24  0.082  46.32-46.38           -
Feb-17         -          -                27.903        37.41-39.79              --                       -                -           -        3.714  38.26-40.69  0.332  43.72-44.28           -
Mar-17         -          -                 0.414        37.03-38.32              --                       -                -           -        1.214  37.88-39.19  0.321  44.71-45.37           -
Apr-17         -          -                 0.294        37.07-38.04              --                       -                -           -        0.377  37.91-38.95  1.226  44.69-45.89           -
May-17         -          -                 5.348        37.08-38.07              --                       -                -           -       12.314  38.05-38.86  0.699  43.68-45.30        1.215
               -          -                 0.607        37.00-38.01              --                       -                -           -        1.226  37.84-38.87  0.390  44.66-44.98        0.020
               -          -                 0.504        37.03-37.86              --                    4.459               -           -        3.626  37.87-38.71                            0.032
               -          -                              37.31-38.67              --                    0.001               -           -               38.19-39.55     -          -
                                                                                                                                                                     0.255  44.94-45.87
                                                                                                                                                                     0.048  45.62-45.81

Source: Financial Markets Operations & Accounting and Budgeting Divisions.