
Page 61 - May 2017
P. 61
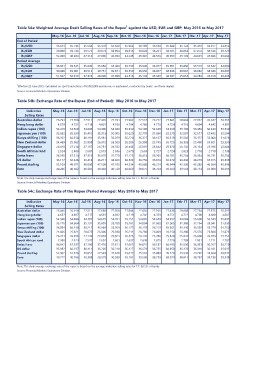
Table 54a: Weighted Average Dealt Selling Rates of the Rupee1 against the USD, EUR and GBP: May 2016 to May 2017

                      May-16 Jun-16 Jul-16 Aug-16 Sep-16 Oct-16 Nov-16 Dec-16 Jan-17 Feb-17 Mar-17 Apr-17 May-17

End of Period         35.613  35.736  35.534  35.378  35.620  35.962  36.109  36.108                                           35.848  35.724  35.410  34.977  34.852
   Rs/USD             39.800  39.748  39.573  39.673  39.894  39.616  38.628  38.221                                           38.585  38.063  37.874  38.186  39.129
   Rs/EUR             52.490  48.384  47.316  47.090  46.030  44.245  45.381  44.578                                           45.059  45.109  44.635  45.686  45.064
   Rs/GBP
                      35.301  35.545  35.600  35.356  35.464  35.739  35.940  36.077                                           35.951  35.650  35.518  35.342  34.890
Period Average        39.968  39.981  39.512  39.751  39.871  39.559  38.950  38.207                                           38.386  38.081  38.082  38.046  38.687
   Rs/USD             51.647  50.919  47.374  46.890  47.098  44.516  45.143  45.352                                           44.697  45.055  44.283  45.018  45.435
   Rs/EUR
   Rs/GBP

1Effective 25 June 2015, Calculated on spot transactions of USD20,000 and above, or equivalent, conducted by banks and forex dealers.
Source: Financial Markets Operations Division.

Table 54b: Exchange Rate of the Rupee (End of Period): May 2016 to May 2017

        Indicative    May-16 Jun-16 Jul-16 Aug-16 Sep-16 Oct-16 Nov-16 Dec-16 Jan-17 Feb-17 Mar-17 Apr-17 May-17
       Selling Rates
Australian dollar     26.294  27.200  27.511  27.320  27.791  27.902  27.574  26.712                                           27.681  28.093  27.822  26.947  26.592
Hong kong dollar       4.679   4.721   4.718   4.691   4.706   4.734   4.766   4.770                                            4.724   4.716   4.694   4.642   4.591
Indian rupee (100)
Japanese yen (100)    54.410  54.500  54.830  54.490  54.840  55.330  54.180  54.640                                           54.300  55.160  56.450  56.440  55.530
Kenya shilling (100)  32.682  35.639  35.416  35.313  36.005  35.029  32.770  31.680                                           32.275  32.507  32.517  32.482  32.204
New Zealand dollar    36.262  36.350  36.191  35.981  36.079  36.220  36.327  36.167                                           35.319  35.506  35.472  35.000  34.626
Singapore dollar      24.469  25.962  25.998  26.372  26.509  26.286  26.398  25.745                                           26.725  26.326  25.460  24.821  25.330
South African rand    26.410  27.218  27.197  26.751  26.782  26.443  25.991  25.642                                           25.878  26.132  26.134  25.936  25.884
Swiss franc
US dollar              2.324   2.480   2.601   2.519   2.636   2.679   2.663   2.727                                            2.724   2.825   2.710   2.710   2.735
Pound sterling        36.596  37.314  37.316  36.979  37.720  37.125  36.414  36.206                                           36.781  36.264  36.354  36.231  36.554
Euro                  36.177  36.446  36.416  36.211  36.306  36.522  36.750  36.816                                           36.472  36.432  36.279  35.915  35.539
                      53.109  48.971  48.080  47.506  47.103  44.534  45.888  45.219                                           45.644  45.300  45.285  46.364  45.546
                      40.286  40.502  40.392  40.402  40.729  40.060  39.075  38.764                                           39.029  38.563  38.713  39.000  39.695

Note: The daily average exchange rate of the rupee is based on the average indicative selling rates for T.T. & D.D. of banks.
Source: Financial Markets Operations Division.

Table 54c: Exchange Rate of the Rupee (Period Average): May 2016 to May 2017

        Indicative    May-16 Jun-16 Jul-16 Aug-16 Sep-16 Oct-16 Nov-16 Dec-16 Jan-17 Feb-17 Mar-17 Apr-17 May-17
       Selling Rates
Australian dollar     26.446  26.918  27.511  27.689  27.568  27.844  27.656  27.106                                           27.436  28.068  27.764  27.375  26.592
Hong kong dollar       4.657   4.697   4.717   4.691   4.692   4.719   4.742   4.763                                            4.751   4.722   4.700   4.680   4.607
Indian rupee (100)
Japanese yen (100)    54.348  54.480  54.701  54.629  54.701  55.151  54.635  54.659                                           54.392  54.884  55.600  56.533  55.837
Kenya shilling (100)  33.216  34.604  35.131  35.895  35.700  35.281  34.004  31.860                                           32.065  32.386  32.264  33.041  31.935
New Zealand dollar    36.094  36.240  36.212  35.969  35.959  36.172  36.178  36.213                                           35.561  35.440  35.559  35.279  34.750
Singapore dollar      24.606  25.621  26.075  26.306  26.598  26.214  26.286  26.009                                           26.250  26.480  25.576  25.388  24.873
South African rand    26.471  26.973  27.146  27.059  26.824  26.523  26.120  25.788                                           25.848  25.944  26.008  26.073  25.751
Swiss franc
US dollar              2.380   2.424   2.547   2.652   2.601   2.637   2.648   2.675                                            2.728   2.789   2.831   2.711   2.707
Pound sterling        36.942  37.537  37.196  37.420  37.311  37.062  36.875  36.182                                           36.495  36.530  36.333  36.267  36.229
Euro                  35.982  36.297  36.411  36.205  36.210  36.427  36.579  36.755                                           36.658  36.470  36.310  36.181  35.642
                      52.302  51.576  48.051  47.539  47.640  45.017  45.510  45.889                                           45.229  45.546  44.792  45.668  46.041
                      40.712  40.766  40.308  40.579  40.599  40.181  39.500  38.759                                           38.974  38.814  38.767  38.730  39.348

Note: The daily average exchange rate of the rupee is based on the average indicative selling rates for T.T. & D.D. of banks.
Source: Financial Markets Operations Division.