
Page 33 - June 2017
P. 33
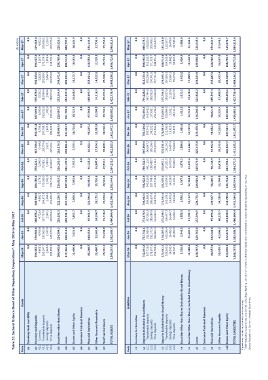
Table 22: Sectoral Balance Sheet of Other Depository Corporations*: May 2016 to May 2017

Code                             Assets                     May-16        Jun-16        Jul-16       Aug-16        Sep-16                                                          Oct-16        Nov-16        Dec-16        Jan-17        Feb-17        Mar-17        Apr-17        (Rs million)
  A1 Monetary Gold and SDRs                                          0.0           0.0          0.0           0.0           0.0                                                             0.0           0.0           0.0           0.0           0.0           0.0           0.0  May-17

                                                                                                                                                                                                                                                                                              0.0

A2 Currency and Deposits                                    396,465.1     379,084.8     388,658.2    383,500.0     384,459.0                                                       378,221.1     415,766.6     386,431.8     387,069.0     376,479.8     392,833.6     396,627.8     419,663.4
A2.1 Currency                                                   4,863.1       4,709.8       4,723.9      4,982.5       5,174.2                                                         5,248.0       5,484.8       6,793.8       6,090.9       5,526.1       5,828.5       5,267.4       4,952.2
A2.2 Transferable deposits
A2.3 Savings deposits                                        193,147.7     187,663.8     187,797.8    184,372.8     179,030.5                                                       179,083.1     183,770.6     197,788.7     180,312.3     181,046.4     191,995.0     173,274.0     209,826.1
A2.4 Time deposits                                              1,460.3       1,337.9       1,182.1      1,464.5       1,541.0                                                         1,289.3       1,510.1       1,325.8       1,251.3       1,333.8       1,456.2       1,305.4       1,513.3

                                                             196,994.0     185,373.3     194,954.4    192,680.3     198,713.3                                                       192,600.7     225,001.1     180,523.5     199,414.5     188,573.6     193,553.9     216,781.0     203,371.8

A3 Securities other than Shares                             200,862.0 214,304.5 219,195.3 222,236.7 216,653.2 219,185.9 219,179.2 230,063.4 228,607.3 233,364.0 249,671.0 238,789.4 229,535.5

A4 Loans                                                    617,426.4 628,314.8 638,531.4 632,315.4 637,374.8 641,137.6 638,501.8 641,564.7 651,796.4 652,637.4 656,021.5 655,512.4 653,737.9

A5 Shares and Other Equity                                  11,490.4      7,621.0       7,852.7      7,850.1       7,853.4                                                         7,797.9       7,769.1 10,726.8 10,722.5 10,648.8 10,172.7 10,181.8 10,141.9

A6 Insurance Technical Reserves                             0.0 0.0 0.0 0.0 0.0 0.0 0.2 0.3 0.0 0.0 0.0 0.0 0.0

A7 Financial Derivatives                                    85,208.7 103,853.1 95,661.9 121,396.8 94,913.6 91,125.2 84,622.1 98,215.4 97,568.8 105,697.7 135,024.2 143,553.1 151,246.4

A8 Other Accounts Receivable                                23,480.7 23,961.4 24,394.7 18,179.2 15,726.8 16,847.4 17,024.3 13,952.0 13,280.5 14,116.9 14,522.8 12,329.5 12,736.9

A9 Nonfinancial Assets                                      25,364.5 25,530.0 25,710.2 25,828.6 28,563.8 29,957.1 30,060.1 30,118.3 29,758.4 29,793.8 29,940.5 29,721.1 29,753.4

      TOTAL ASSETS                                          1,360,297.8 1,382,669.7 1,400,004.4 1,411,306.8 1,385,544.6 1,384,272.3 1,412,923.3 1,411,072.7 1,418,802.9 1,422,738.4 1,488,186.2 1,486,715.0 1,506,815.4

Code                          Liabilities                   May-16        Jun-16        Jul-16       Aug-16        Sep-16                                                          Oct-16        Nov-16        Dec-16        Jan-17        Feb-17        Mar-17        Apr-17        May-17

L1 Currency in Circulation                                  0.0 0.0 0.0 0.0 0.0 0.0 0.0 0.0 0.0 0.0 0.0 0.0 0.0

L2 Deposits Included in Broad Money                         742,844.8     757,741.1     773,978.6    784,603.6     781,822.0                                                       780,712.3     807,060.8     783,510.6     792,494.5     794,128.1     813,333.4     800,985.9     809,578.5
L2.1 Transferable deposits                                   307,756.5     311,866.0     337,865.3    339,389.8     341,319.3                                                       341,112.5     343,047.2     335,746.1     343,648.2     347,744.6     355,200.4     351,910.7     358,823.0
L2.2 Savings deposits                                        178,307.6     182,572.6     185,080.8    186,637.6     187,748.9                                                       188,488.7     189,106.0     196,232.2     197,633.1     199,552.6     200,341.6     201,023.7     200,608.5
L2.3 Time deposits                                           256,780.6     263,302.5     251,032.5    258,576.3     252,753.8                                                       251,111.1     274,907.6     251,532.3     251,213.2     246,830.8     257,791.4     248,051.4     250,147.0

L3 Deposits Excluded from Broad Money                       173,641.1     174,207.9     175,290.5    171,541.4     181,529.6                                                       176,967.1     176,531.9     176,983.9     173,697.6     175,794.8     179,695.1     180,913.0     191,328.0
L3.1 Transferable deposits                                   108,382.5     108,296.4     106,417.3    102,198.1     109,294.5                                                       107,201.5     108,150.2     110,760.0     109,964.5     105,617.6     104,935.3     104,163.4     113,267.7
L3.2 Savings deposits
L3.3 Time deposits                                            16,241.3      16,455.2      16,646.7     16,301.9      16,319.9                                                        16,079.6      16,487.6      15,318.9      15,322.1      15,129.6      15,584.3      15,942.0      16,476.9
                                                              49,017.2      49,456.3      52,226.5     53,041.4      55,915.2                                                        53,686.0      51,894.0      50,905.1      48,411.0      55,047.6      59,175.6      60,807.6      61,583.4

L4 Securities Other than Shares, Included in Broad Money    1,538.5       1,546.3       1,553.3      1,558.2       1,567.8                                                         1,576.2       1,586.6       1,601.6       1,612.3       1,622.1       1,632.8       1,639.6       1,650.0

L5 Securities Other than Shares, Excluded from Broad Money  11,308.6 11,682.1 11,781.9 11,112.9 12,324.0 12,437.4 12,444.7 12,259.5 12,253.0 12,678.6 12,089.9 11,638.9 11,248.6

L6 Loans                                                    140,307.8 129,363.8 137,594.9 124,771.3 114,819.8 119,579.0 126,455.0 133,478.3 136,246.4 124,915.2 134,184.0 139,801.6 131,648.6

L7 Insurance Technical Reserves                             0.0 0.0 0.0 0.0 0.0 0.0 0.0 0.0 0.0 0.0 0.0 0.0 0.0

L8 Financial Derivatives                                    84,857.0 102,648.8 95,096.4 120,627.3 94,406.3 90,138.9 83,962.0 98,054.3 98,021.9 105,597.3 135,487.8 144,302.4 151,841.9

L9 Other Accounts Payable                                   59,959.7 62,606.3 60,239.7 54,386.0 55,344.0 58,078.4 58,355.0 57,859.8 55,135.4 57,405.9 62,433.4 56,697.0 57,648.1

L10 Shares and Other Equity                                 145,840.3 142,873.3 144,469.0 142,706.0 143,731.0 144,783.1 146,527.4 147,324.7 149,341.9 150,596.5 149,329.8 150,736.7 151,871.7

      TOTAL LIABILITIES                                     1,360,297.8 1,382,669.7 1,400,004.4 1,411,306.8 1,385,544.6 1,384,272.3 1,412,923.3 1,411,072.7 1,418,802.9 1,422,738.4 1,488,186.2 1,486,715.0 1,506,815.4

Figures may not add up to totals due to rounding.
* Other Depository Corporations consist of banks holding a Banking Licence and institutions other than banks which are licensed to transact deposit-taking business in Mauritius.

Source: Research and Economic Analysis Department.