
Page 35 - June 2017
P. 35
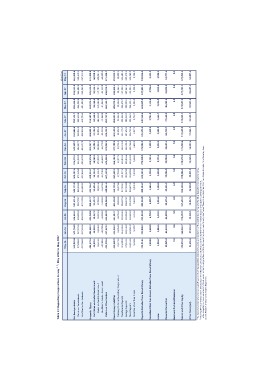
Table 24: Depository Corporations Survey 1 2 : May 2016 to May 2017

                                                         May-16       Jun-16       Jul-16       Aug-16       Sep-16       Oct-16       Nov-16       Dec-16                                                                 Jan-17       Feb-17       Mar-17       Apr-17       (Rs million)
                                                                                                                                                                                                                                                                               May-17

Net Foreign Assets                                       518,022.0    529,764.9    536,626.5    547,521.4    541,173.8    541,487.6    576,673.1    549,150.7                                                              552,006.4    550,124.7    565,446.8    551,541.8    561,428.6
   Claims on Nonresidents                                 875,086.5    897,375.5    901,885.0    919,709.7    885,593.0    875,123.8    912,252.8    903,587.7                                                              910,819.9    898,910.8    946,828.8    946,603.8    958,640.9
   Liabilities to Nonresidents                           -357,064.5   -367,610.6   -365,258.5   -372,188.3   -344,419.2   -333,636.2   -335,579.8   -354,437.0                                                             -358,813.6   -348,786.1   -381,382.0   -395,062.0   -397,212.3

Domestic Claims                                          484,278.4    485,682.3    494,960.0    490,557.7    492,756.7    498,814.7    491,972.6    493,257.7                                                              496,011.5    514,307.8    524,925.9    526,534.9    531,459.8
   Net Claims on Central Government                       48,939.1     48,559.1     50,347.2     51,497.3     52,695.1     51,355.9     50,543.3     54,205.3                                                               57,786.3     60,550.2     58,360.1     59,555.1     60,020.5
        Claims on Central Government                       89,344.2     94,349.5     95,931.4     97,055.5     98,954.6   101,104.3    100,233.0    100,984.1                                                                99,006.9   104,390.2    110,203.0    110,707.1    109,051.1
        Liabilities to Central Government                 -40,405.2    -45,790.4    -45,584.2    -45,558.2    -46,259.5    -49,748.5    -49,689.7    -46,778.8                                                              -41,220.6    -43,840.0    -51,842.9    -51,152.0    -49,030.5
   Claims on Other Sectors
                                                         435,339.4    437,123.2    444,612.8    439,060.4    440,061.6    447,458.8    441,429.4    439,052.4                                                              438,225.3    453,757.6    466,565.7    466,979.7    471,439.2

Broad Money Liabilities                                  449,648.9    454,966.2    461,117.7    461,430.8    461,720.5    467,628.5    466,182.0    477,788.9                                                              482,530.2    484,802.9    485,070.6    486,422.5    493,022.7
   Currency Outside Depository Corporations                26,173.3     26,254.0     26,762.2     26,565.8     26,679.6     27,085.9     26,977.9     29,731.3                                                               28,503.8     28,353.8     28,226.8     28,264.1     28,038.1
   Transferable Deposits
   Savings Deposits                                      115,930.8    116,495.9    118,234.5    116,987.6    117,359.1    121,877.2    119,043.2    122,416.8                                                              124,179.7    125,663.3    126,578.7    127,498.1    133,603.1
   Time Deposits                                         178,142.2    182,445.8    185,004.0    186,531.7    187,659.0    188,421.9    189,046.4    196,181.0                                                              197,603.1    199,510.7    200,300.1    200,961.2    200,378.1
   Securities other than Shares                          124,146.6    124,361.8    125,625.9    125,909.0    124,477.9    124,689.6    125,549.6    123,766.6                                                              126,716.6    125,542.4    124,111.1    123,884.1    125,268.8

                                                             5,256.1      5,408.7      5,491.2      5,436.7      5,544.9      5,553.9      5,564.9      5,693.2                                                                5,527.1      5,732.7      5,853.8      5,815.0      5,734.5

Deposits Excluded from Broad Money                       321,814.1 332,441.3 343,094.0 353,548.5 350,404.2 343,223.1 371,815.5 339,503.5 341,879.8 341,560.6 361,007.0 347,451.3 349,029.0

Securities Other than Shares, Excluded from Broad Money  2,244.8      2,626.0      2,708.5      2,095.7      3,226.3      3,345.6      3,391.6      3,198.9                                                                3,245.8      3,721.0      3,110.6      2,706.4      2,361.5

Loans                                                    4,561.7      4,416.1      4,439.5      4,352.2      3,480.6      3,290.0      3,333.4      3,236.8                                                                3,225.8      3,111.7      3,031.8      3,018.1      2,846.9

Financial Derivatives                                    28,925.8 24,269.8 26,228.6 29,175.2 28,631.5 33,086.8 33,084.4 30,683.1 26,740.7 37,620.9 46,323.9 49,009.8 53,787.1

Insurance Technical Reserves                             0.0 0.0 0.0 0.0 0.0 0.0 0.0 0.0 0.0 0.0 0.0 0.0 0.0

Shares and Other Equity                                  170,419.2 168,868.7 170,402.1 167,639.2 169,538.6 170,886.9 170,970.3 171,014.6 172,530.8 174,093.2 171,927.3 172,781.2 173,433.5

Other Items (net)                                        24,686.0 27,859.2 23,596.1 19,837.6 16,928.8 18,841.3 19,868.5 16,982.6 17,864.7 19,522.2 19,901.5 16,687.4 18,407.6

1 The Depository Corporations Survey covers the accounts of the depository corporations and is a consolidation of the Central Bank Survey and the Other Depository Corporations Survey.
2 Following IMF recommendations in January 2013, with effect from January 2010, liabilities to Central Government now include deposits of budgetary central government,

  extra-budgetary units and social security funds, as well as their holdings of Bank of Mauritius securities, which were formerly classified as "Deposits and Securities Other than Shares, Excluded from Monetary Base".
Source: Research and Economic Analysis Department.