
Page 37 - June 2017
P. 37
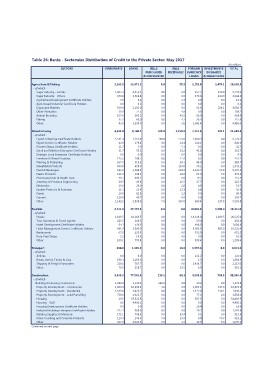
Table 26: Banks - Sectorwise Distribution of Credit to the Private Sector: May 2017
SECTORS OVERDRAFTS LOANS BILLS BILLS FOREIGN INVESTMENTS (Rs million)
PURCHASED RECEIVABLE CURRENCY IN SHARES TOTAL
& DISCOUNTED
LOANS & DEBENTURES
Agriculture & Fishing 3,162.8 13,671.2 0.0 55.5 2,259.0 1,470.1 20,618.5
- of which
Sugar Industry - Estates 1,605.3 6,053.4 0.0 0.0 652.2 816.0 9,126.9
Sugar Industry - Others 670.8 1,563.8 0.0 0.0 379.6 430.0 3,044.2
Agricultural Development Certificate Holders 7.6 0.0 2.4 0.0
Agro-based Industrial Certificate Holders 0.0 6.1 0.0 0.0 0.0 0.0 16.1
Sugarcane Planters 569.4 0.2 0.0 0.0 61.3 0.0 0.2
Other Plantation 30.9 2,182.0 0.0 4.8 0.0 224.1
Animal Breeding 157.6 72.5 0.0 41.5 86.0 0.0 3,036.7
Fishing 37.3 383.2 0.0 4.1 36.4 0.0 108.2
Other 83.9 60.0 0.0 2.6 1,043.4 0.0 668.3
3,350.0 0.0 137.9
4,480.0
Manufacturing 4,691.0 8,140.3 168.8 1,258.9 7,157.8 193.1 21,609.8
- of which
Export Enterprise Certificate Holders 1,531.3 1,151.9 160.9 274.6 2,609.4 0.0 5,728.1
Export Service Certificate Holders 42.0 179.4 0.0 14.4 610.1 0.0 846.0
Pioneer Status Certificate Holders 11.7 5.9 0.0 5.1 0.1 0.0 22.7
Small and Medium Enterprise Certificate Holders 51.7 55.1 0.0 13.2 41.6 0.0 161.7
Strategic Local Enterprise Certificate Holders 0.0 0.0 0.0 0.0 0.0 0.0 0.0
Furniture & Wood Products 108.7 0.0 27.4 0.5 0.0 252.1
Printing & Publishing 115.5 519.5 0.0 54.1 48.9 0.0 889.7
Steel/Metal Products 267.3 699.3 0.0 78.1 0.0
Food & Beverages 508.8 0.0 159.0 55.8 1,445.2
Plastic Products 632.2 1,568.5 0.0 293.2 2,626.7 0.0 5,176.4
Pharmaceuticals & Health Care 121.3 146.2 0.0 85.0 0.0
Jewellery & Precision Engineering 608.2 0.0 18.8 79.5 0.0 371.2
Electronics 49.7 45.8 0.0 0.0 27.7 0.0 737.4
Leather Products & Footwear 36.5 28.0 0.0 0.0 0.0 125.5
Paints 25.6 21.4 0.0 15.5 0.8 0.0
Cement 21.1 62.8 0.0 2.0 0.0 0.0 55.7
Other 16.8 40.7 7.9 0.0 137.3 56.6
116.0 13.3 80.9
1,143.2 2,898.9 1.2 949.4 156.7
0.0 5,503.8
367.0
Tourism 3,234.5 17,273.5 0.0 0.0 18,001.5 1,905.4 40,414.9
- of which
Hotels 1,813.5 10,163.5 0.0 0.0 13,628.4 1,019.5 26,625.0
Tour Operators & Travel Agents 225.5 146.5
Hotel Development Certificate Holders 64.1 536.6 0.0 0.0 60.4 0.0 432.4
Hotel Management Service Certificate Holders 961.3
Restaurants 67.8 5,380.9 0.0 0.0 498.0 0.0 1,098.6
Duty-Free Shops 2.2 232.4
Other 100.1 13.8 0.0 0.0 3,093.3 885.9 10,321.4
799.8
0.0 0.0 332.0 0.0 632.2
0.0 0.0 0.0 0.0 16.0
0.0 0.0 389.4 0.0 1,289.4
Transport 480.0 1,959.9 0.0 13.5 1,557.6 0.0 4,011.1
- of which
Airlines 0.8 0.0 0.0 0.0 121.2 0.0 122.0
Buses, Lorries, Trucks & Cars 190.1 1,163.6 0.0 0.0 1.3 0.0 1,354.9
Shipping & Freight Forwarders 218.6 0.0 0.0 1,428.7 0.0 2,215.0
Other 567.7 0.0 13.5 6.5 0.0 319.1
70.5 228.7
Construction 5,443.9 77,541.0 218.1 60.1 4,535.9 765.3 88,564.4
- of which
Building & Housing Contractors 1,096.0 1,219.1 208.6 9.0 39.2 0.0 2,572.0
Property Development - Commercial 1,000.3 10,332.3 1.6 0.0 1,005.1 537.6 12,876.9
Property Development - Residential 1,343.6 0.0 0.0 2,422.6 148.1
Property Development - Land Parcelling 4,026.2 0.0 0.0 7,940.5
Housing 758.6 1,022.7 0.0 0.0 77.1 0.0 1,858.4
Housing - Staff 19.5 53,522.8 0.0 0.0 927.5 0.0 54,469.8
Housing Development Certificate Holders 0.0 4,430.1 0.0 0.0 0.0 4,430.1
Industrial Building Enterprise Certificate Holders 0.0 0.0 0.0 0.0 0.0
Building Supplies & Materials 0.0 0.0 33.4 19.4 0.0 19.4
Stone Crushing and Concrete Products 317.1 960.6 7.9 15.9 26.2 0.0 1,304.0
Other 171.1 708.3 0.0 1.7 79.7
110.4 296.3 0.1 0.0 912.9
Continued on next page 627.3 1,022.5 0.0 510.2
18.7 1,670.2