
Page 38 - June 2017
P. 38
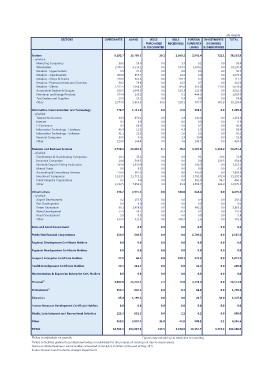
SECTORS OVERDRAFTS LOANS BILLS BILLS (Rs million)
PURCHASED RECEIVABLE
& DISCOUNTED FOREIGN INVESTMENTS TOTAL
CURRENCY IN SHARES
LOANS & DEBENTURES
Traders 8,103.7 16,788.3 30.2 1,969.2 2,941.4 721.1 30,553.9
- of which
Marketing Companies 36.6 59.0 0.0 3.7 0.1 0.0 99.4
Wholesalers 2,438.4 6,113.1 5.6 573.3 1,040.1 0.0 10,170.5
Retailers - Hypermarkets 0.0 0.0
Retailers - Supermarkets 9.5 27.2 0.0 0.0 0.0 0.0 36.7
Retailers - Shops & Snacks 200.8 855.7 0.0 16.6 0.0 0.0 1,073.1
Retailers - Pharmaceuticals and Chemists 240.8 365.8 0.0 104.1 0.5 0.0
Retailers - Others 0.0 16.2 0.7 119.3 711.2
Automobile Dealers & Garages 68.2 79.8 0.0 191.6 354.0 0.0 165.0
Petroleum and Energy Products 1,412.4 1,466.3 0.0 535.3 123.9 0.0 3,543.6
Tyre Dealers and Suppliers 1,946.5 0.0 444.3 0.0 3,516.2
Other 910.5 24.5 0.1 0.0 601.8 1,059.0
379.4 235.2 0.3 977.7
25.2 528.1 54.8
29.3 10,124.4
2,377.8 5,614.5
Information Communication and Technology 278.7 1,111.6 0.0 17.0 398.1 0.0 1,805.4
- of which
Telecommunications 40.3 870.2 0.0 1.8 242.0 0.0 1,154.3
Internet 0.3 0.0 0.0 0.0 0.0 0.0 0.3
E-Commerce 0.4 0.0 0.0 0.1 0.0 60.8
Information Technology - Hardware 60.4 0.0 4.3 1.5 0.0 58.4
Information Technology - Software 40.3 12.3 0.0 2.0 0.3 0.0 55.2
Personal Computers 31.1 21.8 0.0 1.3 10.4 0.0 51.8
Other 39.5 0.0 7.6 143.7 0.0 424.5
126.8 0.6
146.4
Financial and Business Services 3,790.3 23,853.9 3.1 35.8 5,307.0 1,284.2 34,274.3
- of which
Stockbrokers & Stockbroking Companies 20.1 15.1 0.0 0.0 9.1 29.6 73.9
Insurance Companies 14.4 506.3 0.0 0.0 0.4 133.5 654.6
Nonbank Deposit-Taking Institutions 163.6 2,859.4 0.0 0.0 196.3 3,219.2
Mutual Funds 0.0 0.0 0.0 0.0
Accounting & Consultancy Services 0.0 0.3 0.0 0.0 465.6 0.0 0.3
Investment Companies 276.0 862.3 0.0 0.0 1,765.9 0.0 1,603.8
Public Financial Corporations 1,103.5 11,751.1 0.0 0.0 365.0 672.4 15,292.9
Other 3.1 35.8 2,504.7 84.7
0.3 0.0 363.9 450.1
2,212.5 7,859.6 12,979.5
Infrastructure 296.2 2,975.3 0.0 360.0 844.4 0.0 4,475.8
- of which
Airport Development 0.2 157.5 0.0 0.0 0.4 0.0 158.1
Port Development 0.0 0.0 0.0 0.0 0.0 0.0 0.0
Power Generation 86.1 0.0 0.0 842.2 0.0 3,385.1
Water Development 55.3 2,456.8 0.0 50.3 0.1 0.0 145.3
Road Development 5.8 39.7 0.0 0.0 0.0 0.0 5.8
Other 148.9 0.0 0.0 309.7 1.6 0.0 781.5
321.3
State and Local Government 0.5 0.0 0.0 0.0 0.0 0.0 0.5
Public Nonfinancial Corporations 156.8 644.5 0.0 0.0 1,706.2 0.0 2,507.6
Regional Development Certificate Holders 0.0 0.0 0.0 0.0 0.0 0.0 0.0
Regional Headquarters Certificate Holders 0.0 0.0 0.0 0.0 0.0 0.0 0.0
Freeport Enterprise Certificate Holders 22.8 44.3 0.0 830.1 175.9 0.0 1,073.1
Health Development Certificate Holders 36.3 211.3 0.0 0.0 41.5 0.0 289.0
Modernisation & Expansion Enterprise Cert. Holders 0.0 0.0 0.0 0.0 0.0 0.0 0.0
Personal 1 4,002.0 22,252.3 2.3 15.0 2,239.4 0.0 28,511.0
Professional 2 0.0 8.1 68.0 0.0 1,270.6
352.2 842.3
Education 65.4 1,199.3 0.0 0.0 20.7 30.0 1,315.4
Human Resource Development Certificate Holders 0.0 0.0 0.0 0.0 0.0 0.0 0.0
Media, Entertainment and Recreational Activities 125.3 681.3 0.0 2.1 0.2 0.0 809.0
Other 459.1 2,847.4 31.0 44.9 900.1 2.1 4,284.6
TOTAL 34,701.5 192,037.8 453.5 4,670.0 48,154.7 6,371.3 286,388.9
1Refers to individuals on payrolls. Figures may not add up to totals due to rounding.
2Refers to facilities granted to professional bodies or individuals for the purpose of carrying out day-to-day business.
Claims on Global Business Licence Holders amounted to Rs56,875.9 million at the end of May 2017.
Source: Research and Economic Analysis Department.