
Page 68 - June 2017
P. 68
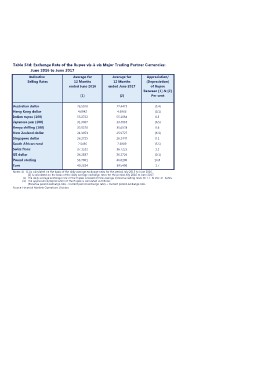
Table 54d: Exchange Rate of the Rupee vis-à-vis Major Trading Partner Currencies:
             June 2016 to June 2017

 Indicative              Average for      Average for     Appreciation/
Selling Rates             12 Months        12 Months      (Depreciation)
                      ended June 2016  ended June 2017
                                                              of Rupee
                                [1]              [2]    between [1] & [2]

                                                              Per cent

Australian dollar     26.5010          27.4475          (3.4)
Hong Kong dollar      4.6942           4.6966           (0.1)
Indian rupee (100)    55.2722          55.1034          0.3
Japanese yen (100)    31.3067          33.4835          (6.5)
Kenya shilling (100)  35.8570          35.6528          0.6
New Zealand dollar    24.3353          25.9727          (6.3)
Singapore dollar      26.2725          26.2447          0.1
South African rand    2.5436           2.6909           (5.5)
Swiss franc           37.1522          36.7225          1.2
US dollar             36.2387          36.2726          (0.1)
Pound sterling        53.7801          46.0290          16.8
Euro                  40.2324          39.5406          1.7

Notes: (i) [1] is calculated on the basis of the daily average exchange rates for the period July 2015 to June 2016.
                [2] is calculated on the basis of the daily average exchange rates for the period July 2016 to June 2017.

           (ii) The daily average exchange rate of the Rupee is based on the average indicative selling rates for T.T. & D.D. of banks.
          (iii) The appreciation/depreciation of the Rupee is calculated as follows:

                (Previous period exchange rate - Current period exchange rate) ÷ Current period exchange rate.

Source: Financial Markets Operations Division.