
Page 56 - May 2017
P. 56
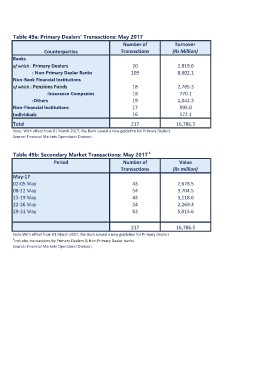
Table 49a: Primary Dealers' Transactions: May 2017

                                                Number of                                   Turnover
                                                                                           (Rs Million)
             Counterparties                     Transactions
                                                                                             2,819.6
Banks                                                                                        8,602.1

of which : Primary Dealers                      20                                           2,785.3
                                                                                              770.1
        : Non-Primary Dealer Banks              109                                          1,042.3
                                                                                              595.0
Non-Bank Financial Institutions                                                               172.1

of which : Pensions Funds                       18

             :Insurance Companies               18

        :Others                                 19

Non-Financial Institutions                      17

Individuals                                     16

Total                                           217                                        16,786.5

Note: With effect from 01 March 2017, the Bank issued a new guideline for Primary Dealers

Source: Financial Markets Operations Division.

Table 49b: Secondary Market Transactions: May 2017 1

                 Period                         Number of                                     Value
                                                                                           (Rs million)
                                                Transactions
                                                                                             2,678.5
May-17                                                                                       3,704.5
                                                                                             3,118.6
02-05 May                                       43                                           2,269.3
                                                                                             5,015.6
08-12 May                                       54

15-19 May                                       43

22-26 May                                       24

29-31 May                                       53

                                                                  217                      16,786.5

Note:With effect from 01 March 2017, the Bank issued a new guideline for Primary Dealers
1Includes transactions by Primary Dealers & Non-Primary Dealer banks
Source: Financial Markets Operations Division.