
Page 67 - June 2017
P. 67
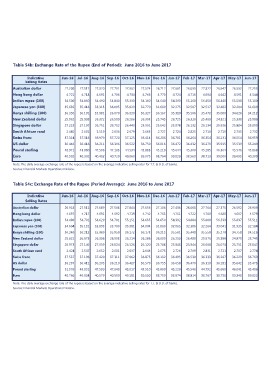
Table 54b: Exchange Rate of the Rupee (End of Period): June 2016 to June 2017

            Indicative   Jun-16 Jul-16 Aug-16 Sep-16 Oct-16 Nov-16 Dec-16 Jan-17 Feb-17 Mar-17 Apr-17 May-17 Jun-17
          Selling Rates
Australian dollar        27.200  27.511  27.320  27.791  27.902  27.574  26.712  27.681                                        28.093  27.822  26.947  26.592  27.253
Hong kong dollar          4.721   4.718   4.691   4.706   4.734   4.766   4.770   4.724                                         4.716   4.694   4.642   4.591   4.544
Indian rupee (100)
Japanese yen (100)       54.500  54.830  54.490  54.840  55.330  54.180  54.640  54.300                                        55.160  56.450  56.440  55.530  55.100
Kenya shilling (100)     35.639  35.416  35.313  36.005  35.029  32.770  31.680  32.275                                        32.507  32.517  32.482  32.204  31.680
New Zealand dollar       36.350  36.191  35.981  36.079  36.220  36.327  36.167  35.319                                        35.506  35.472  35.000  34.626  34.212
Singapore dollar         25.962  25.998  26.372  26.509  26.286  26.398  25.745  26.725                                        26.326  25.460  24.821  25.330  25.986
South African rand       27.218  27.197  26.751  26.782  26.443  25.991  25.642  25.878                                        26.132  26.134  25.936  25.884  25.800
Swiss franc
US dollar                 2.480   2.601   2.519   2.636   2.679   2.663   2.727   2.724                                         2.825   2.710   2.710   2.735   2.732
Pound sterling           37.314  37.316  36.979  37.720  37.125  36.414  36.206  36.781                                        36.264  36.354  36.231  36.554  36.959
Euro                     36.446  36.416  36.211  36.306  36.522  36.750  36.816  36.472                                        36.432  36.279  35.915  35.539  35.240
                         48.971  48.080  47.506  47.103  44.534  45.888  45.219  45.644                                        45.300  45.285  46.364  45.546  45.868
                         40.502  40.392  40.402  40.729  40.060  39.075  38.764  39.029                                        38.563  38.713  39.000  39.695  40.289

Note: The daily average exchange rate of the rupee is based on the average indicative selling rates for T.T. & D.D. of banks.
Source: Financial Markets Operations Division.

Table 54c: Exchange Rate of the Rupee (Period Average): June 2016 to June 2017

            Indicative   Jun-16 Jul-16 Aug-16 Sep-16 Oct-16 Nov-16 Dec-16 Jan-17 Feb-17 Mar-17 Apr-17 May-17 Jun-17
          Selling Rates
Australian dollar        26.918  27.511  27.689  27.568  27.844  27.656  27.106  27.436                                        28.068  27.764  27.375  26.592  26.909
Hong kong dollar          4.697   4.717   4.691   4.692   4.719   4.742   4.763   4.751                                         4.722   4.700   4.680   4.607   4.579
Indian rupee (100)
Japanese yen (100)       54.480  54.701  54.629  54.701  55.151  54.635  54.659  54.392                                        54.884  55.600  56.533  55.837  55.511
Kenya shilling (100)     34.604  35.131  35.895  35.700  35.281  34.004  31.860  32.065                                        32.386  32.264  33.041  31.935  32.184
New Zealand dollar       36.240  36.212  35.969  35.959  36.172  36.178  36.213  35.561                                        35.440  35.559  35.279  34.750  34.516
Singapore dollar         25.621  26.075  26.306  26.598  26.214  26.286  26.009  26.250                                        26.480  25.576  25.388  24.873  25.745
South African rand       26.973  27.146  27.059  26.824  26.523  26.120  25.788  25.848                                        25.944  26.008  26.073  25.751  25.847
Swiss franc
US dollar                 2.424   2.547   2.652   2.601   2.637   2.648   2.675   2.728                                         2.789   2.831   2.711   2.707   2.774
Pound sterling           37.537  37.196  37.420  37.311  37.062  36.875  36.182  36.495                                        36.530  36.333  36.267  36.229  36.769
Euro                     36.297  36.411  36.205  36.210  36.427  36.579  36.755  36.658                                        36.470  36.310  36.181  35.642  35.473
                         51.576  48.051  47.539  47.640  45.017  45.510  45.889  45.229                                        45.546  44.792  45.668  46.041  45.406
                         40.766  40.308  40.579  40.599  40.181  39.500  38.759  38.974                                        38.814  38.767  38.730  39.348  39.822

Note: The daily average exchange rate of the rupee is based on the average indicative selling rates for T.T. & D.D. of banks.
Source: Financial Markets Operations Division.